


Queries and charts
The agent rarely writes a query. It names the data it wants, and quanthea writes and tests the query from a query builder or a saved query. That costs fewer tokens and breaks fewer panels. Admins choose the builders, write saved queries, and choose the charts the agent may draw.
Settings → Queries
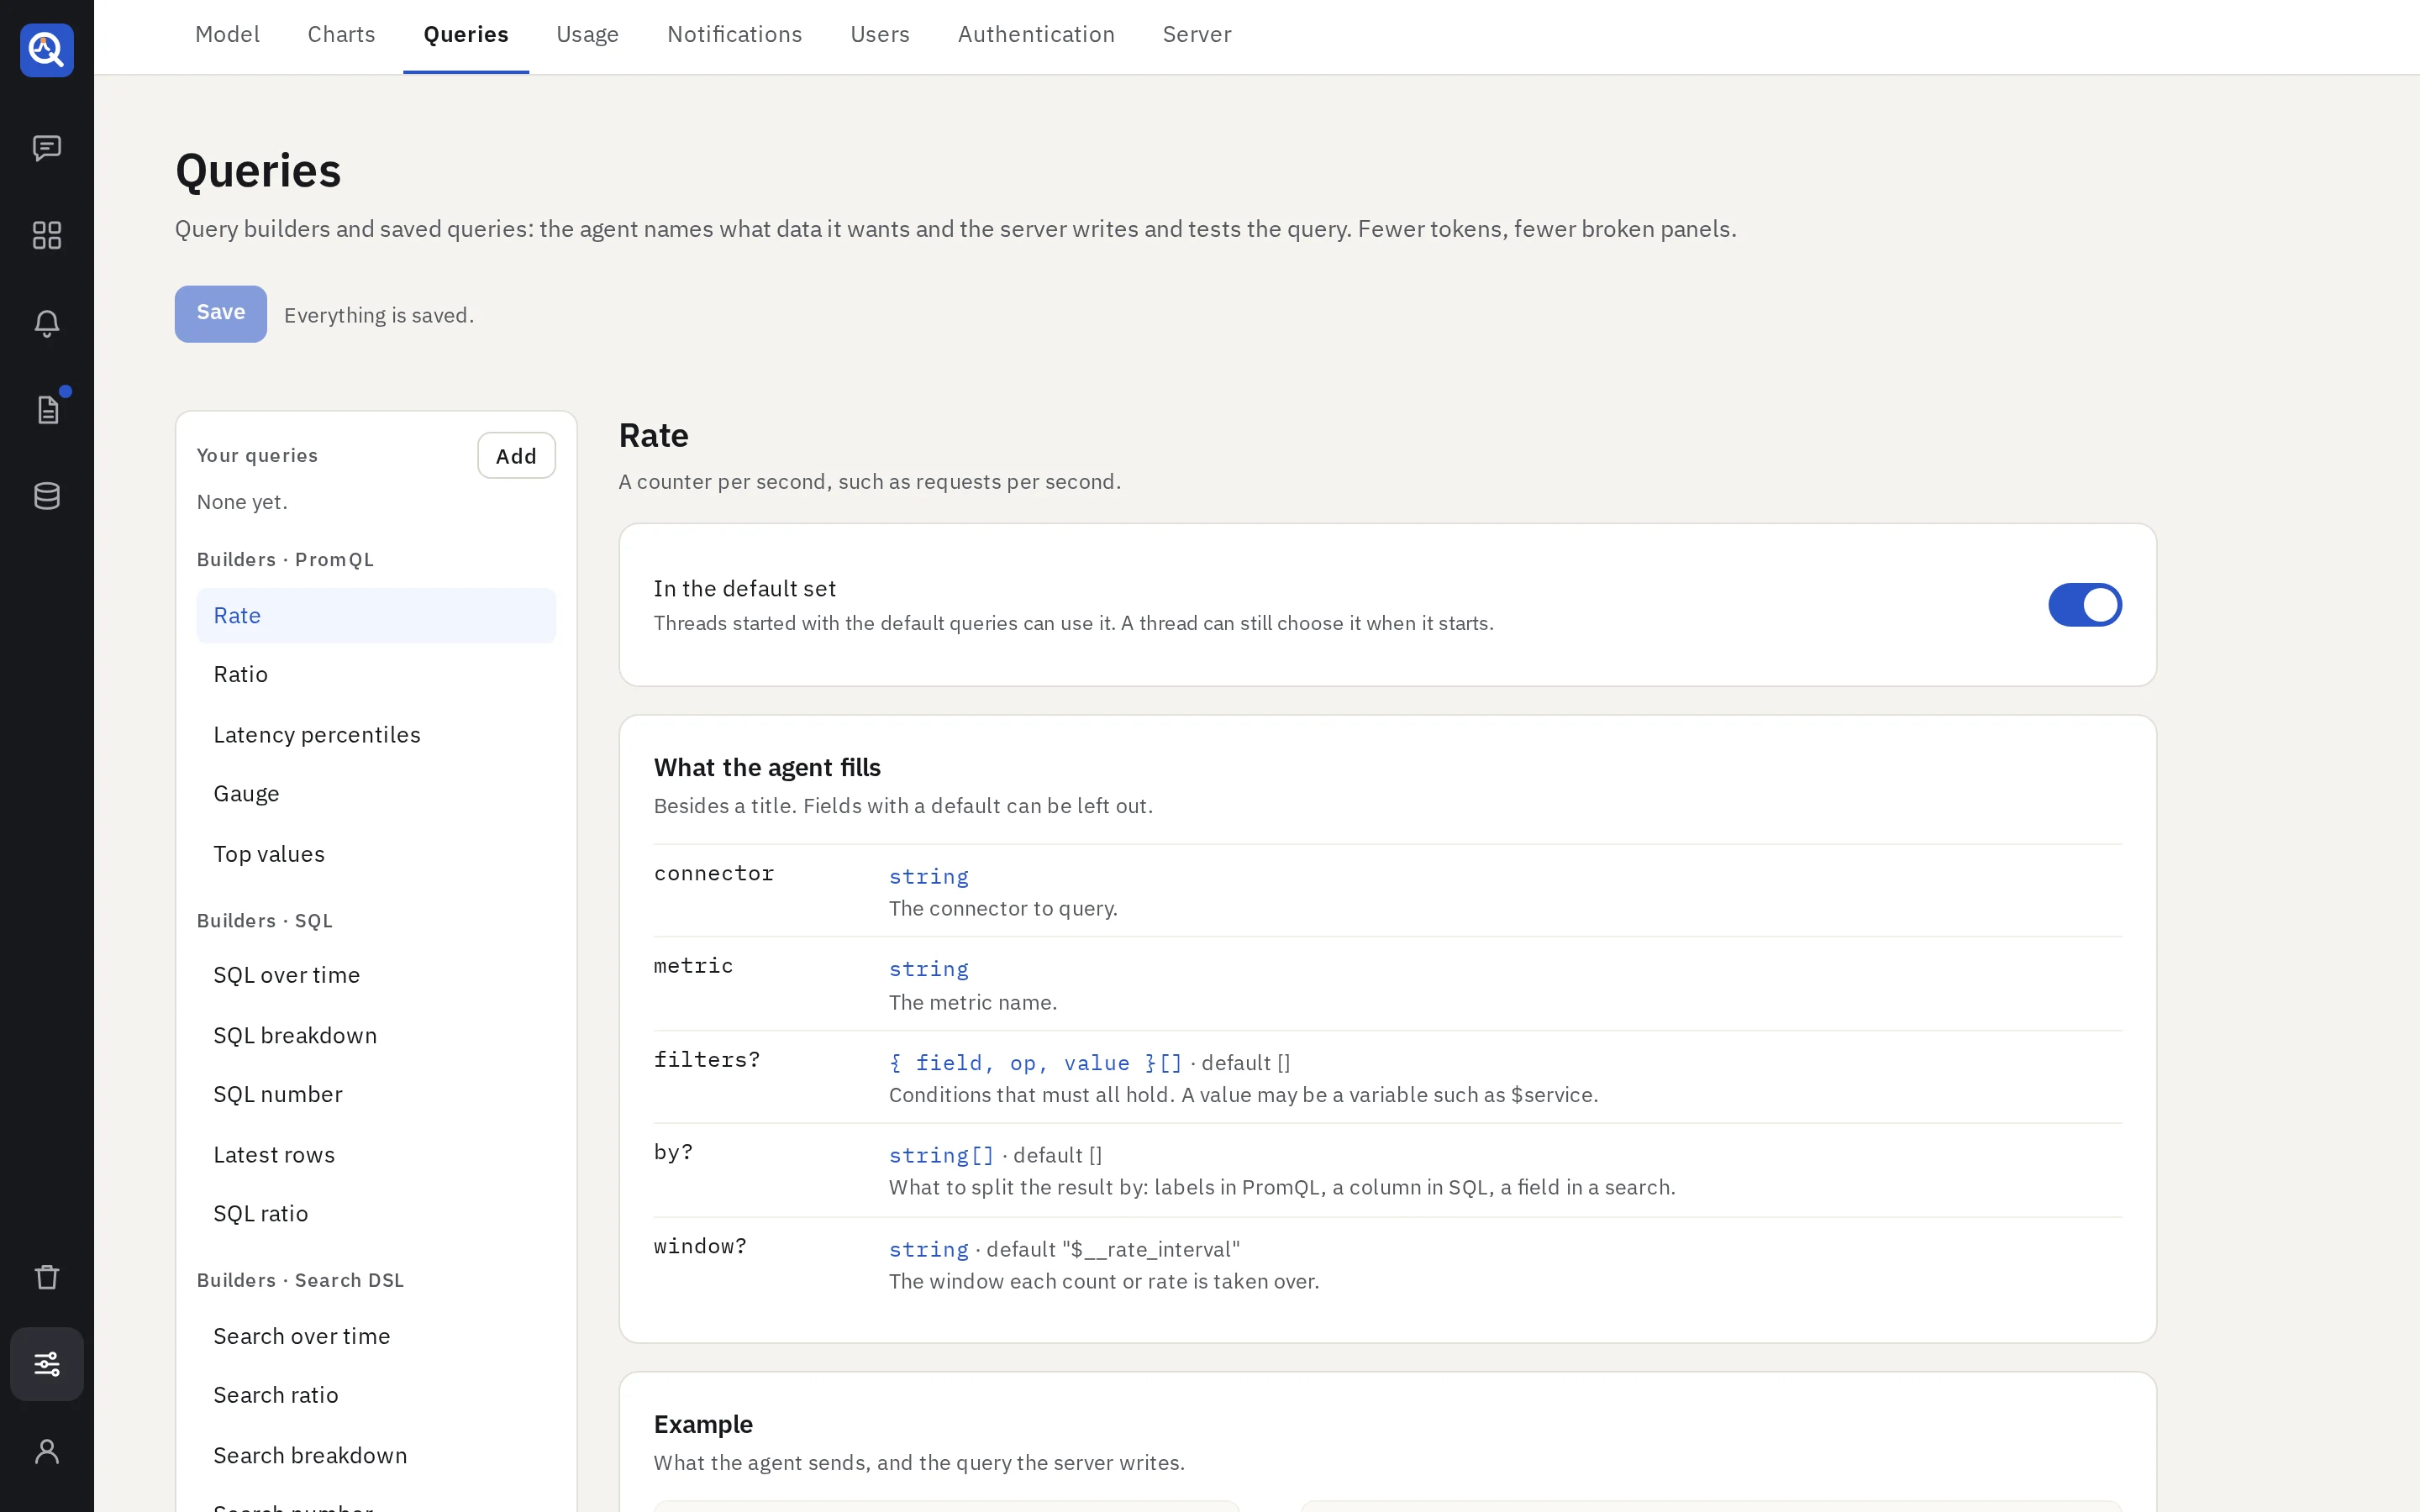
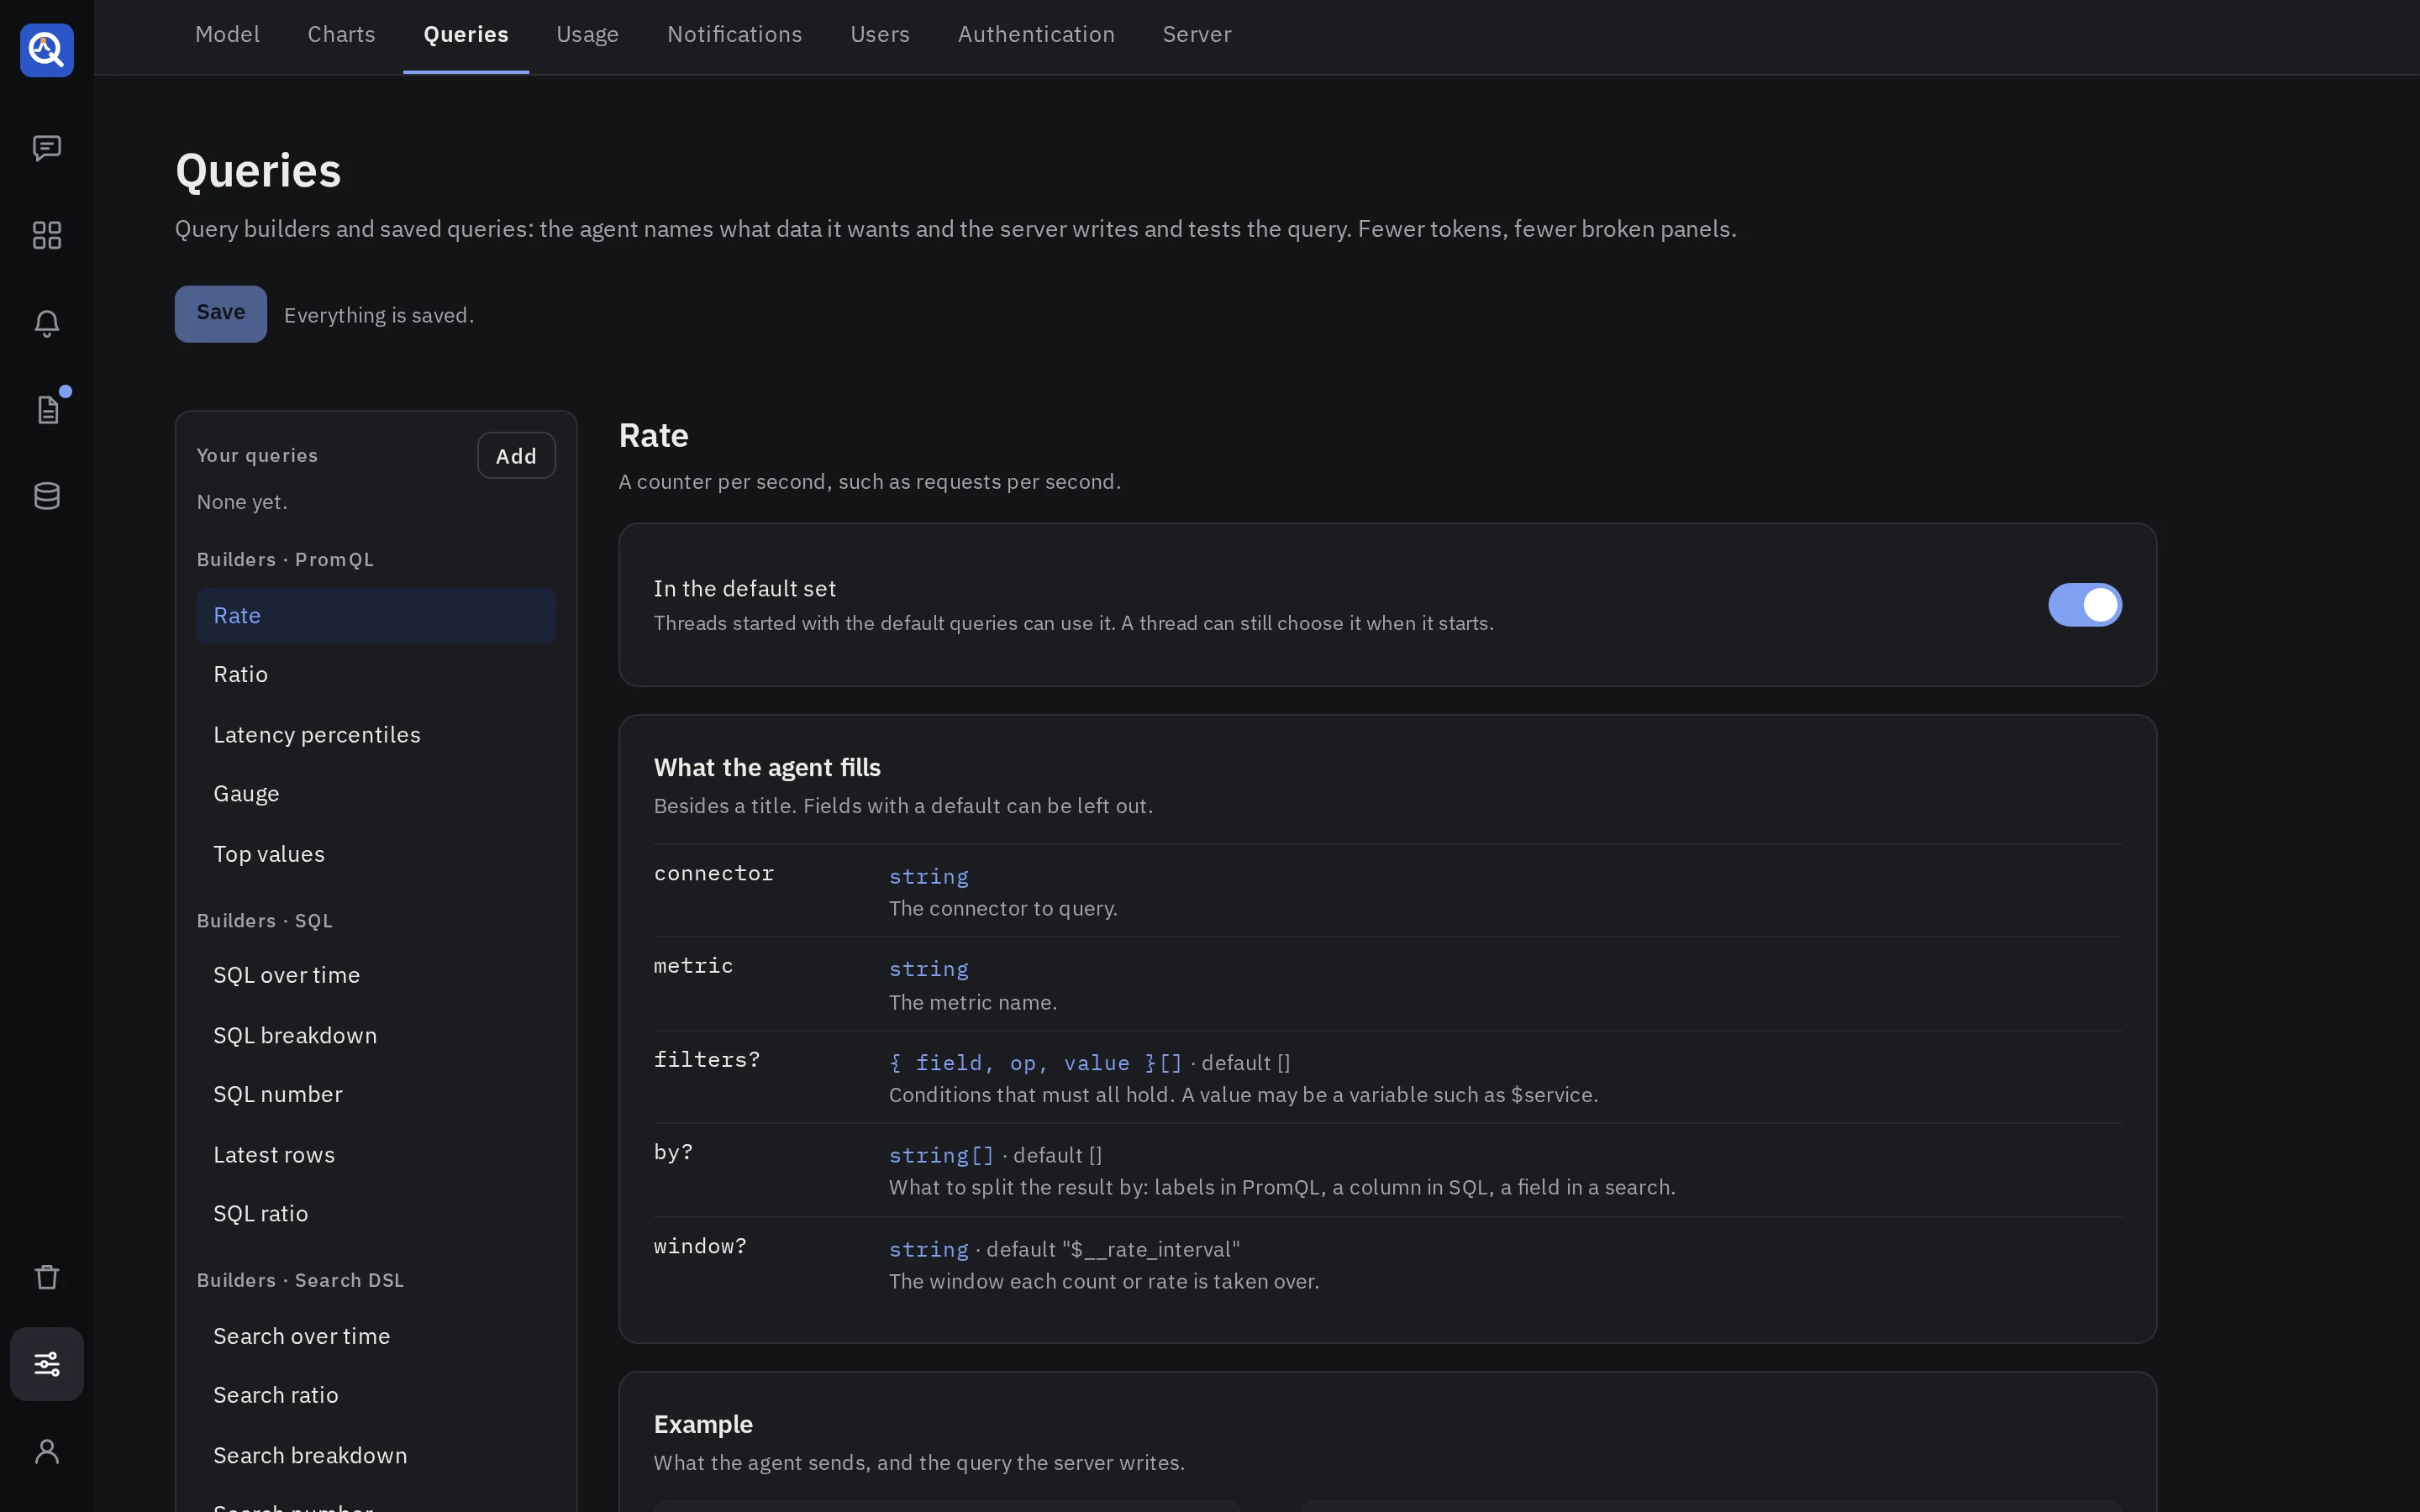
Query builders
quanthea ships builders for each query language: rates, ratios (such as 5xx over all requests), latency percentiles and top N for PromQL; series over time, breakdowns, single numbers and rows for SQL; the same for search, LogQL and MongoDB. Each writes a query for its source’s dialect, with names checked and quoted and variables bound.
Each builder shows its fields, an example, the query it becomes, and what it returns. Try it runs the example on a connector and time range you choose, and draws it. Nothing is saved, and no model runs.
Switch a builder off, and the agent stops using it.
Saved queries
A saved query is your own query, in any language, with placeholders such as {{service}}. Each
placeholder has a type: a metric, a label, a table, a column, a value or a duration. Give the query
an id, one sentence that says what it returns, and the shape of its result. The agent asks for it by
id with a value for each placeholder, and quanthea checks and quotes each value before it runs.
Use them for the numbers your team defines one way: “active customers”, “revenue net of refunds”. Run a saved query on a connector before you keep it.
Which queries a thread uses
When an editor starts a thread, they choose:
- Default queries: the builders switched on, and every saved query.
- Choose queries…: some of them.
- Free style: raw queries only.
Settings → Charts
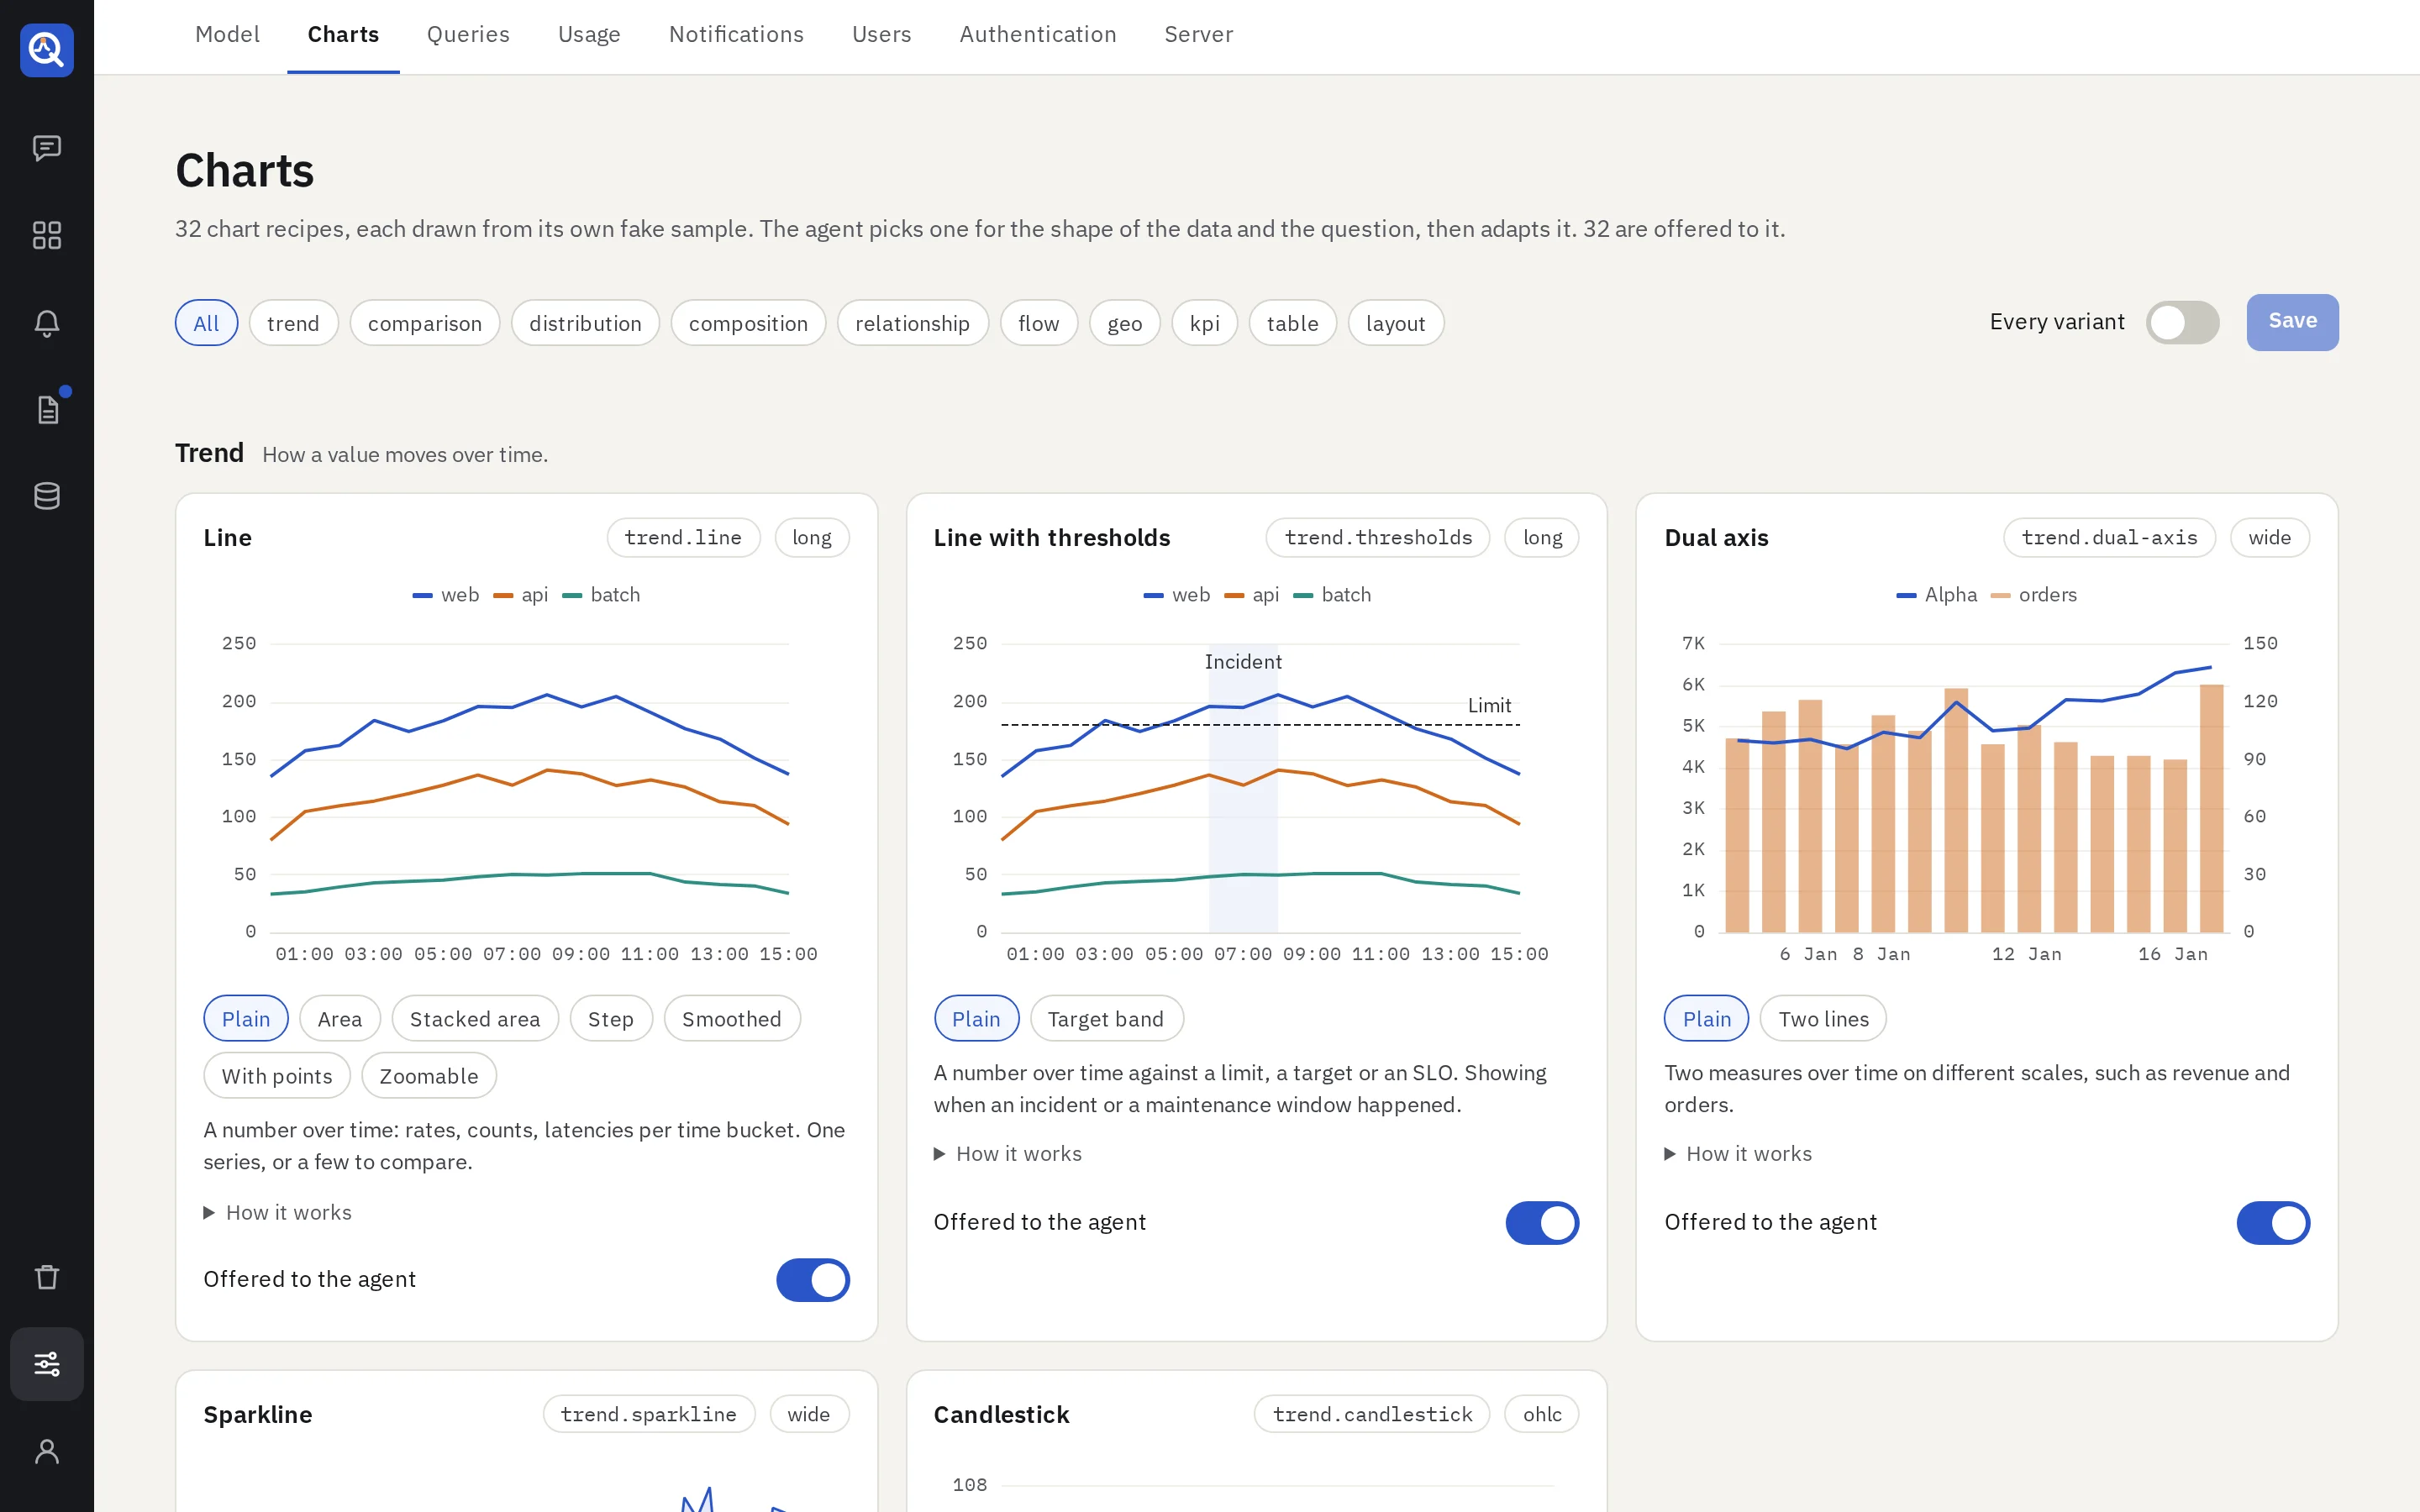
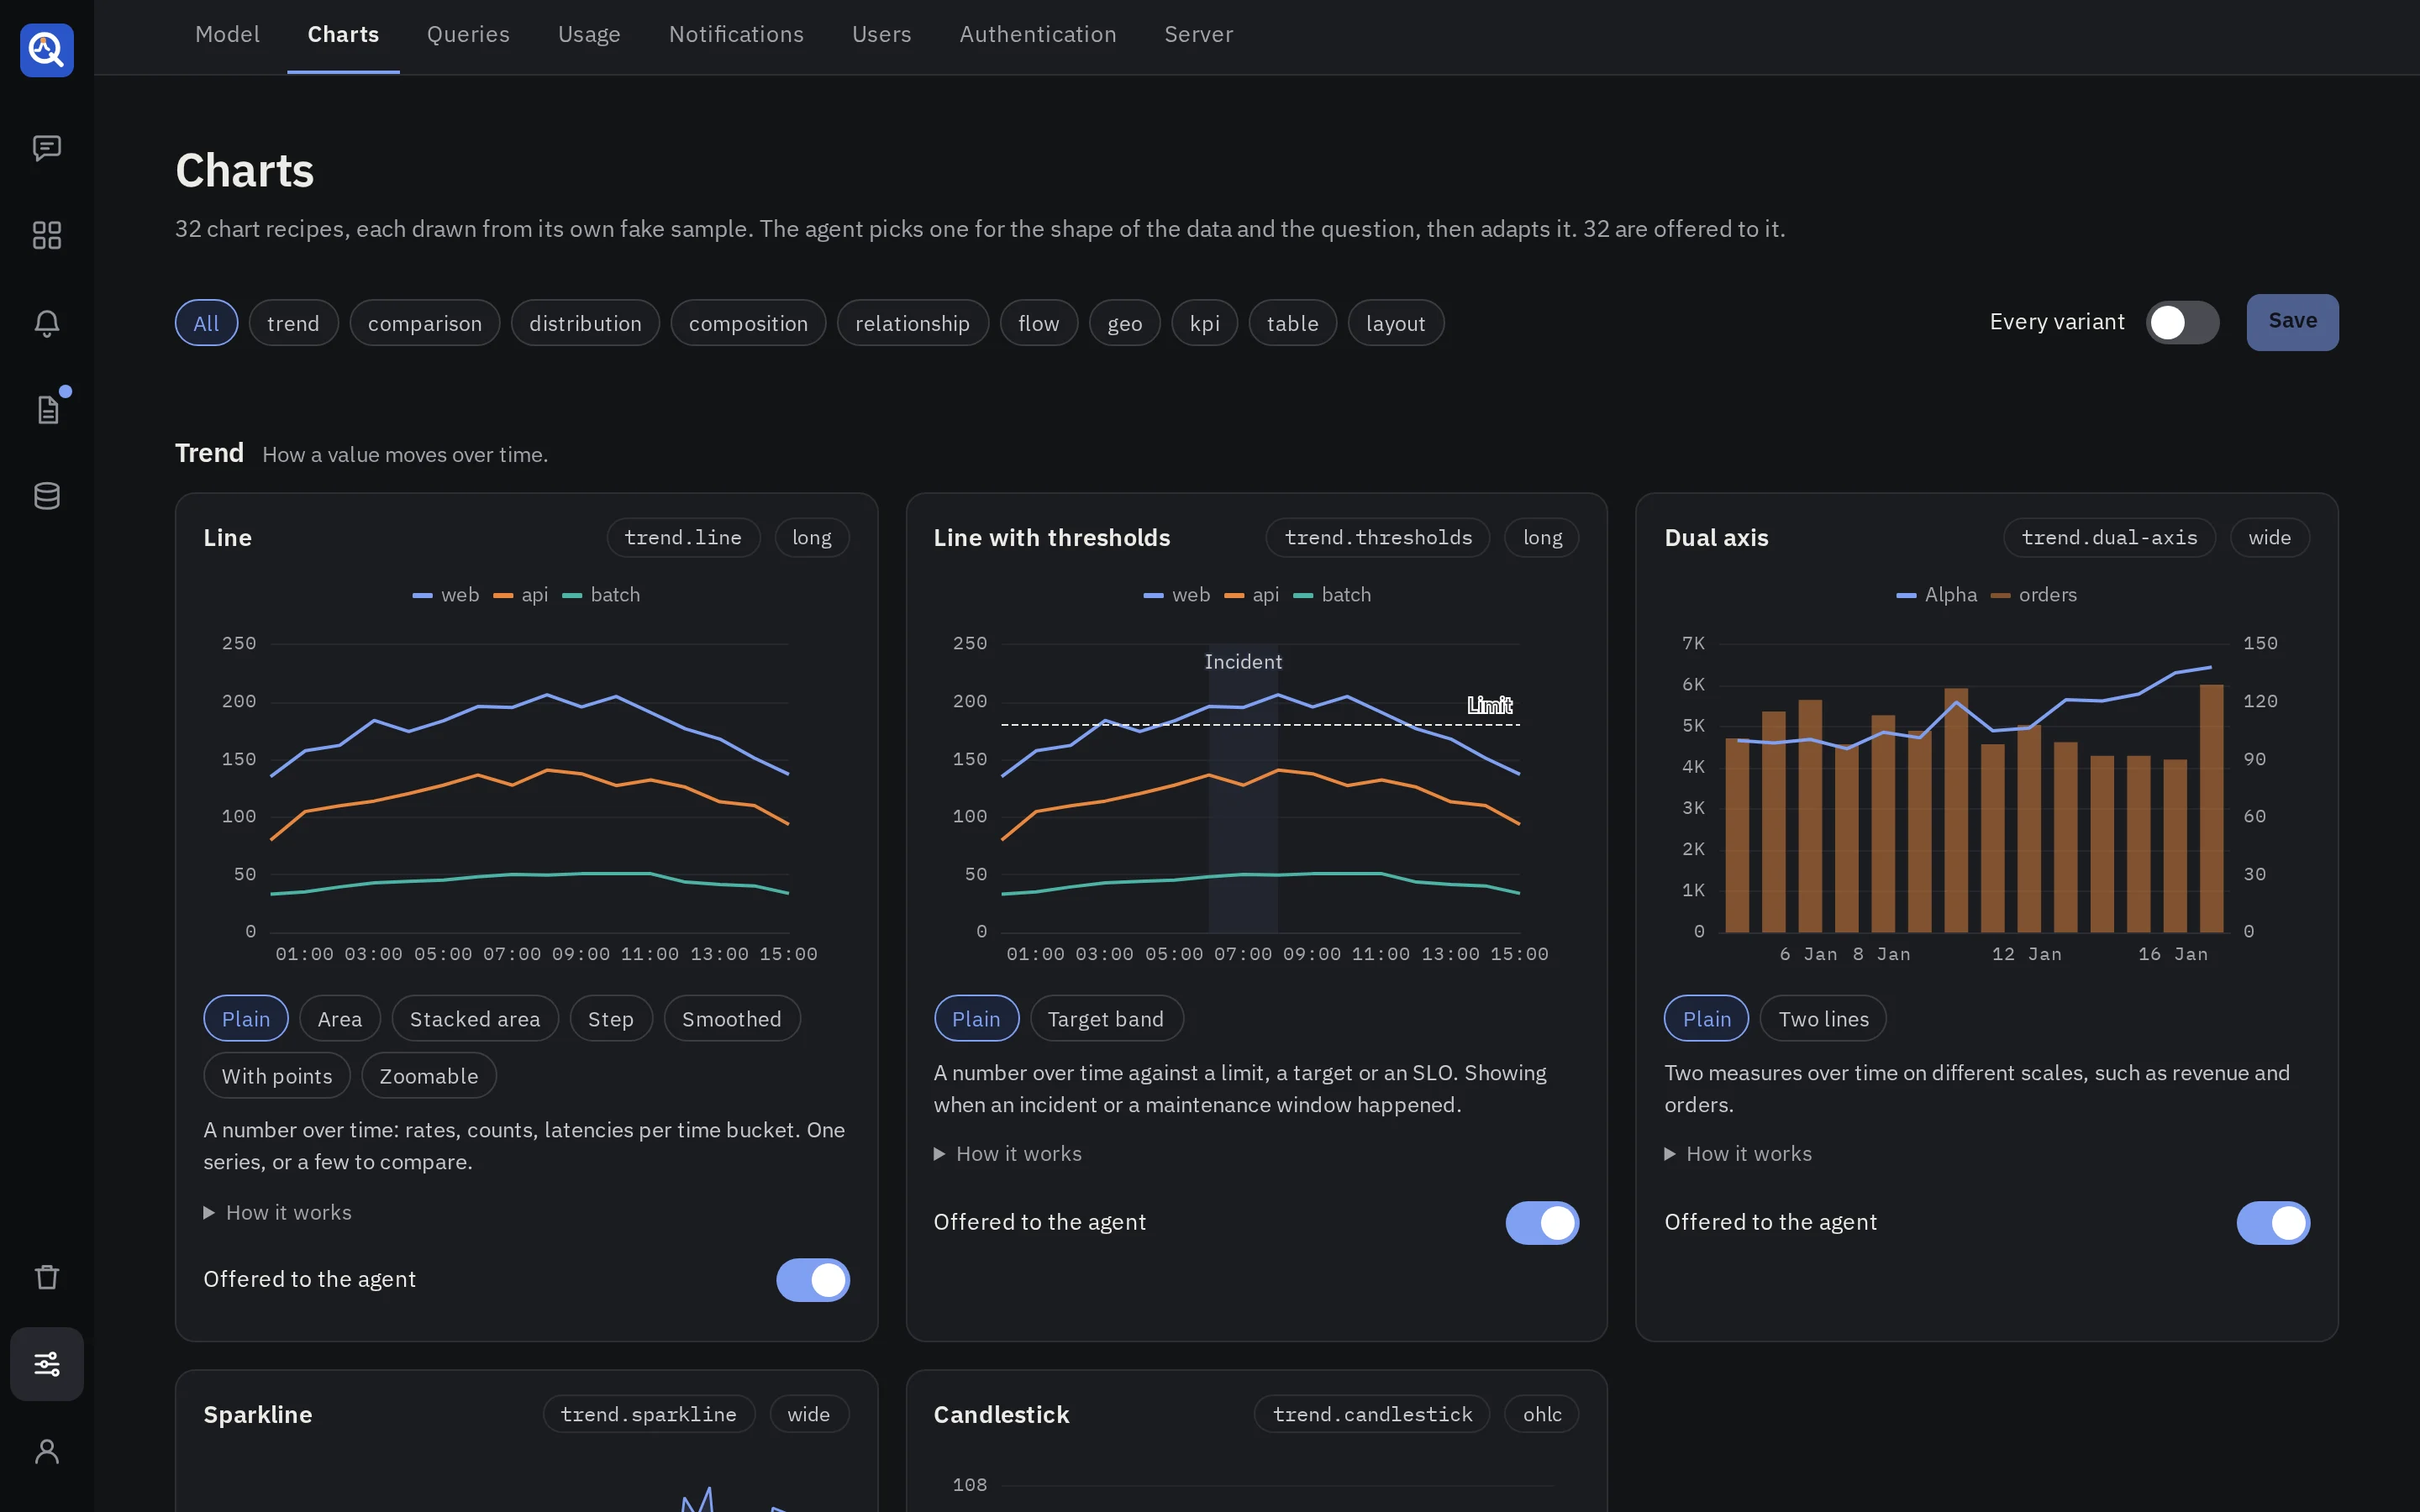
The agent draws with chart recipes: about thirty of them, for trends, comparisons, distributions, composition, relationships, flows, maps, numbers, tables and small multiples. The page draws each recipe and its variants from a sample. Switch one off, and the agent no longer offers it; at least one stays on.
Charts never run code from the model: a recipe is a fixed template, and values are formatted with named formatters only.
In the configuration file
queries switches builders off and declares saved queries; charts switches recipes off. See
the configuration file.