


Dashboards
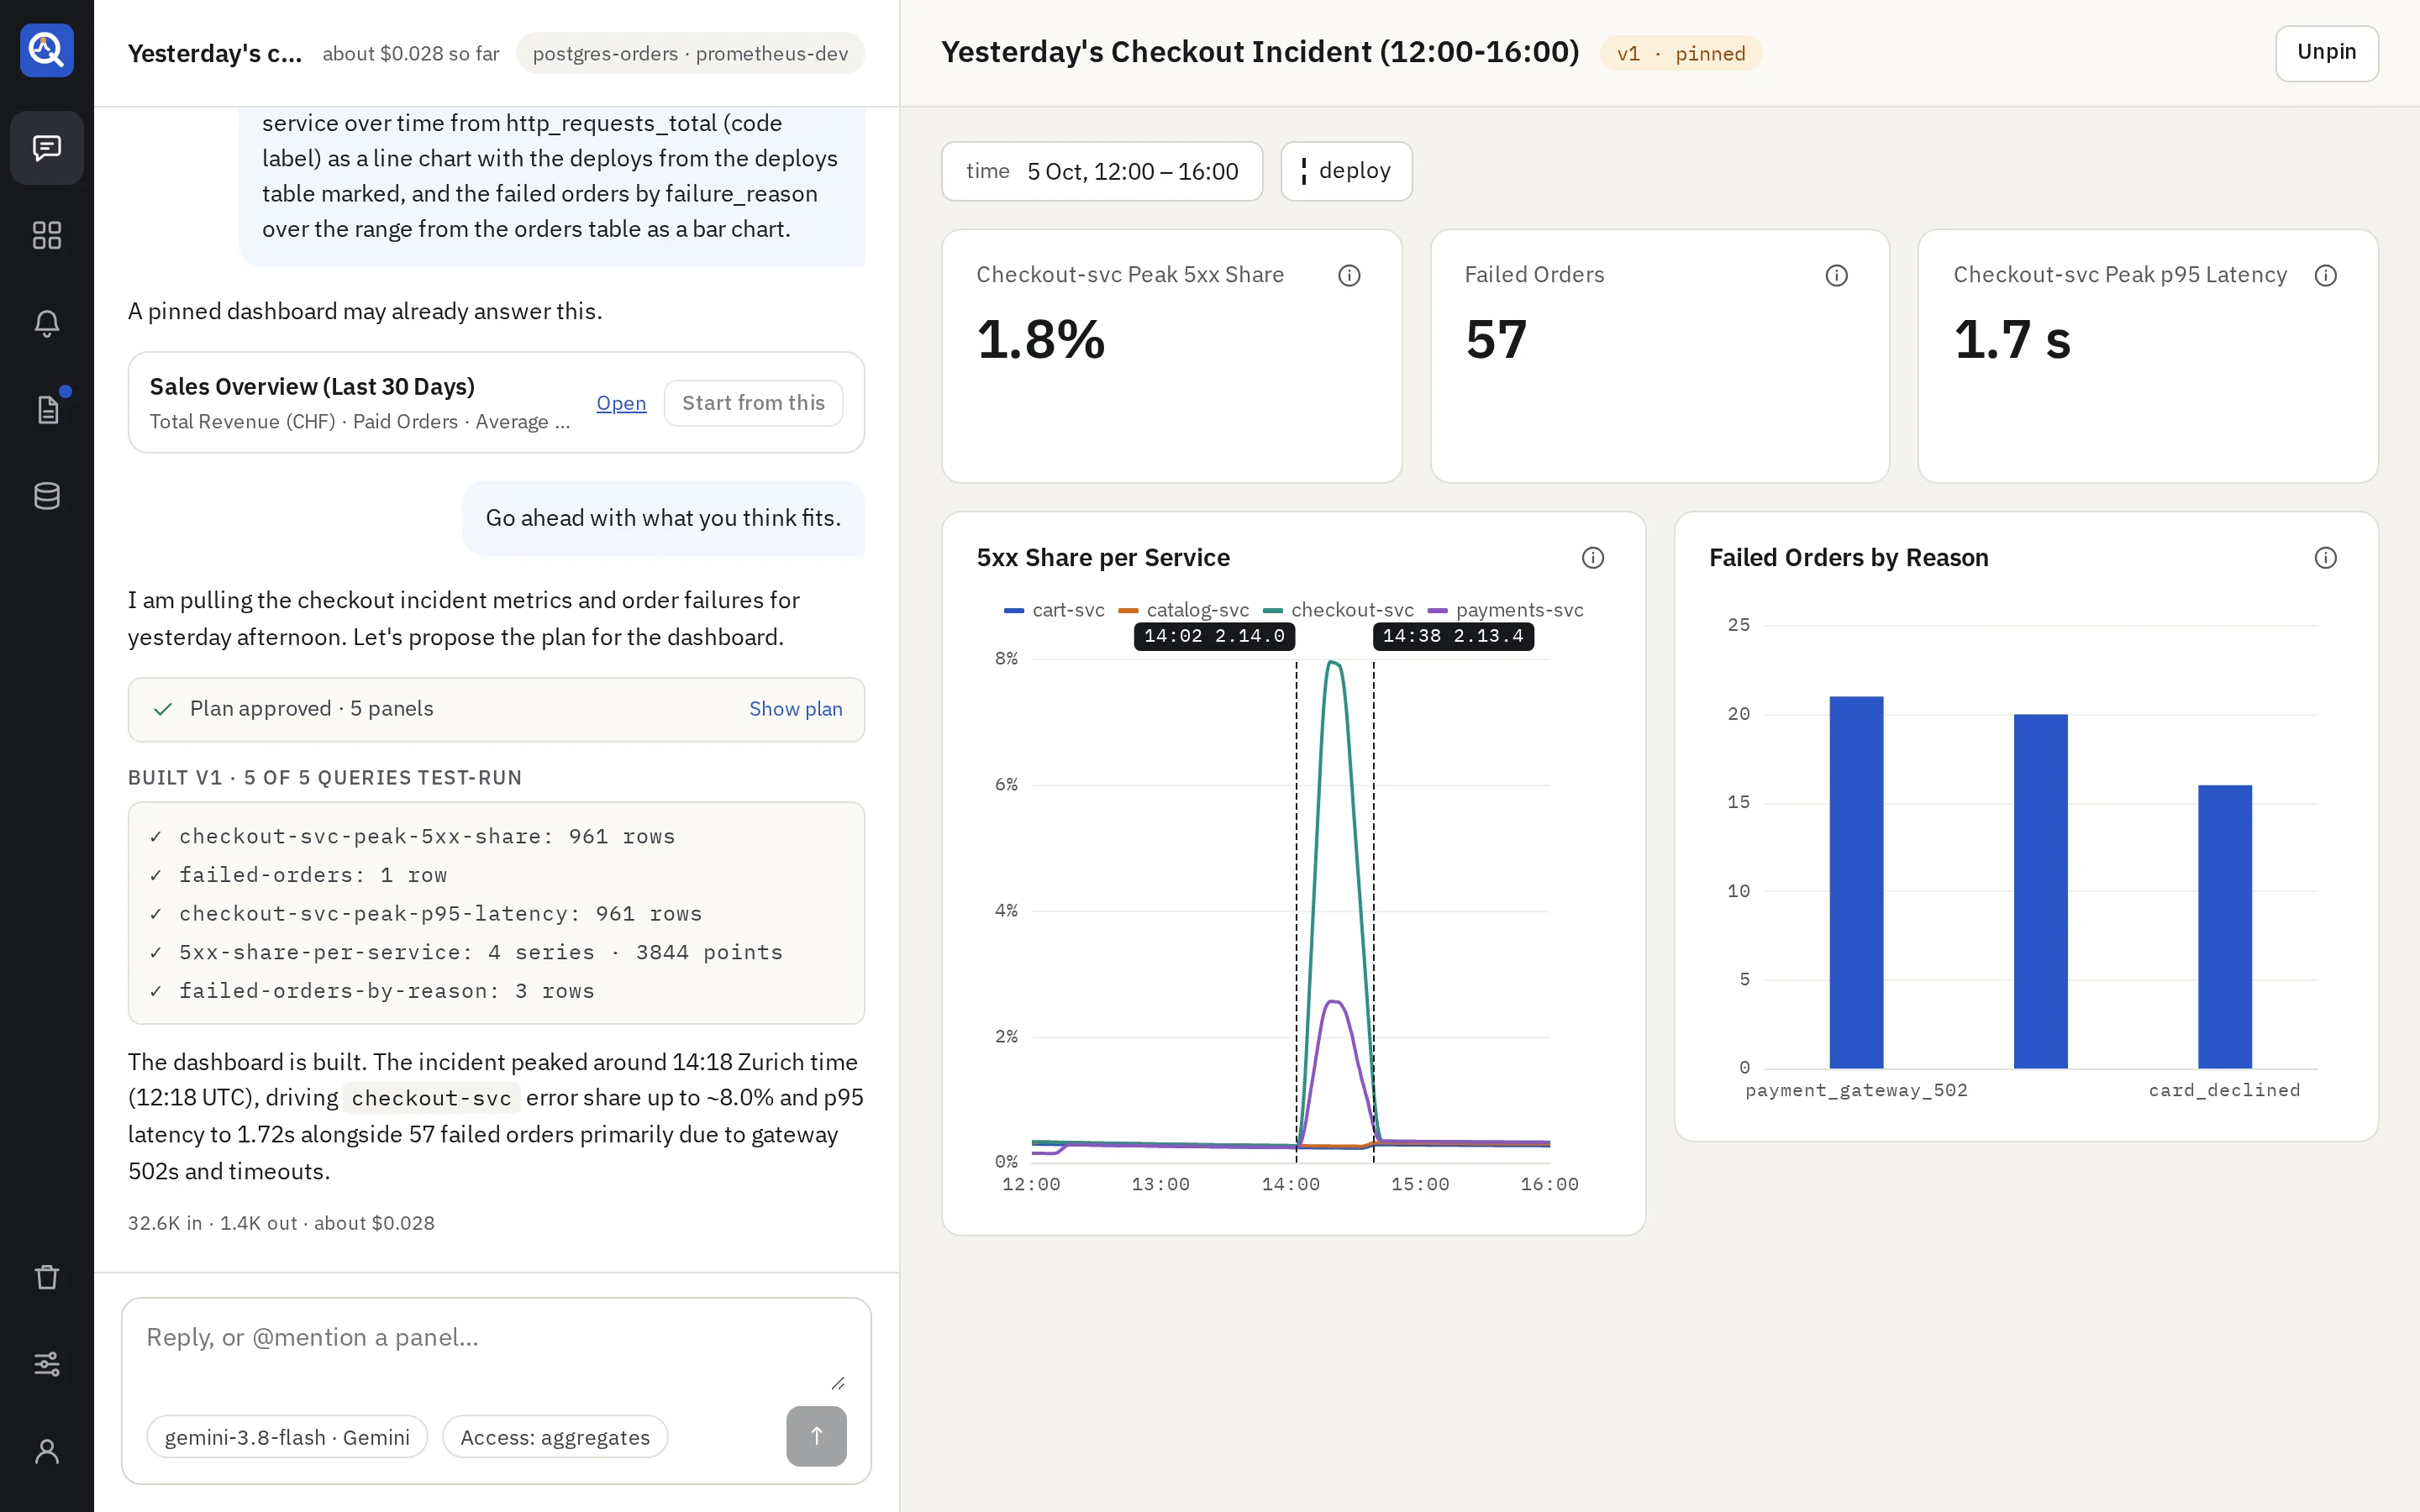
A dashboard starts as a conversation. You say what you want to see, the agent proposes a plan, you approve it, and the dashboard builds beside the conversation. You refine it in the same thread and pin the version you want to keep. Pinned dashboards render with no model involved.
Building needs the editor role. Every role reads pinned dashboards.
Start a thread
Open Threads. The question box sits in the middle of the screen.
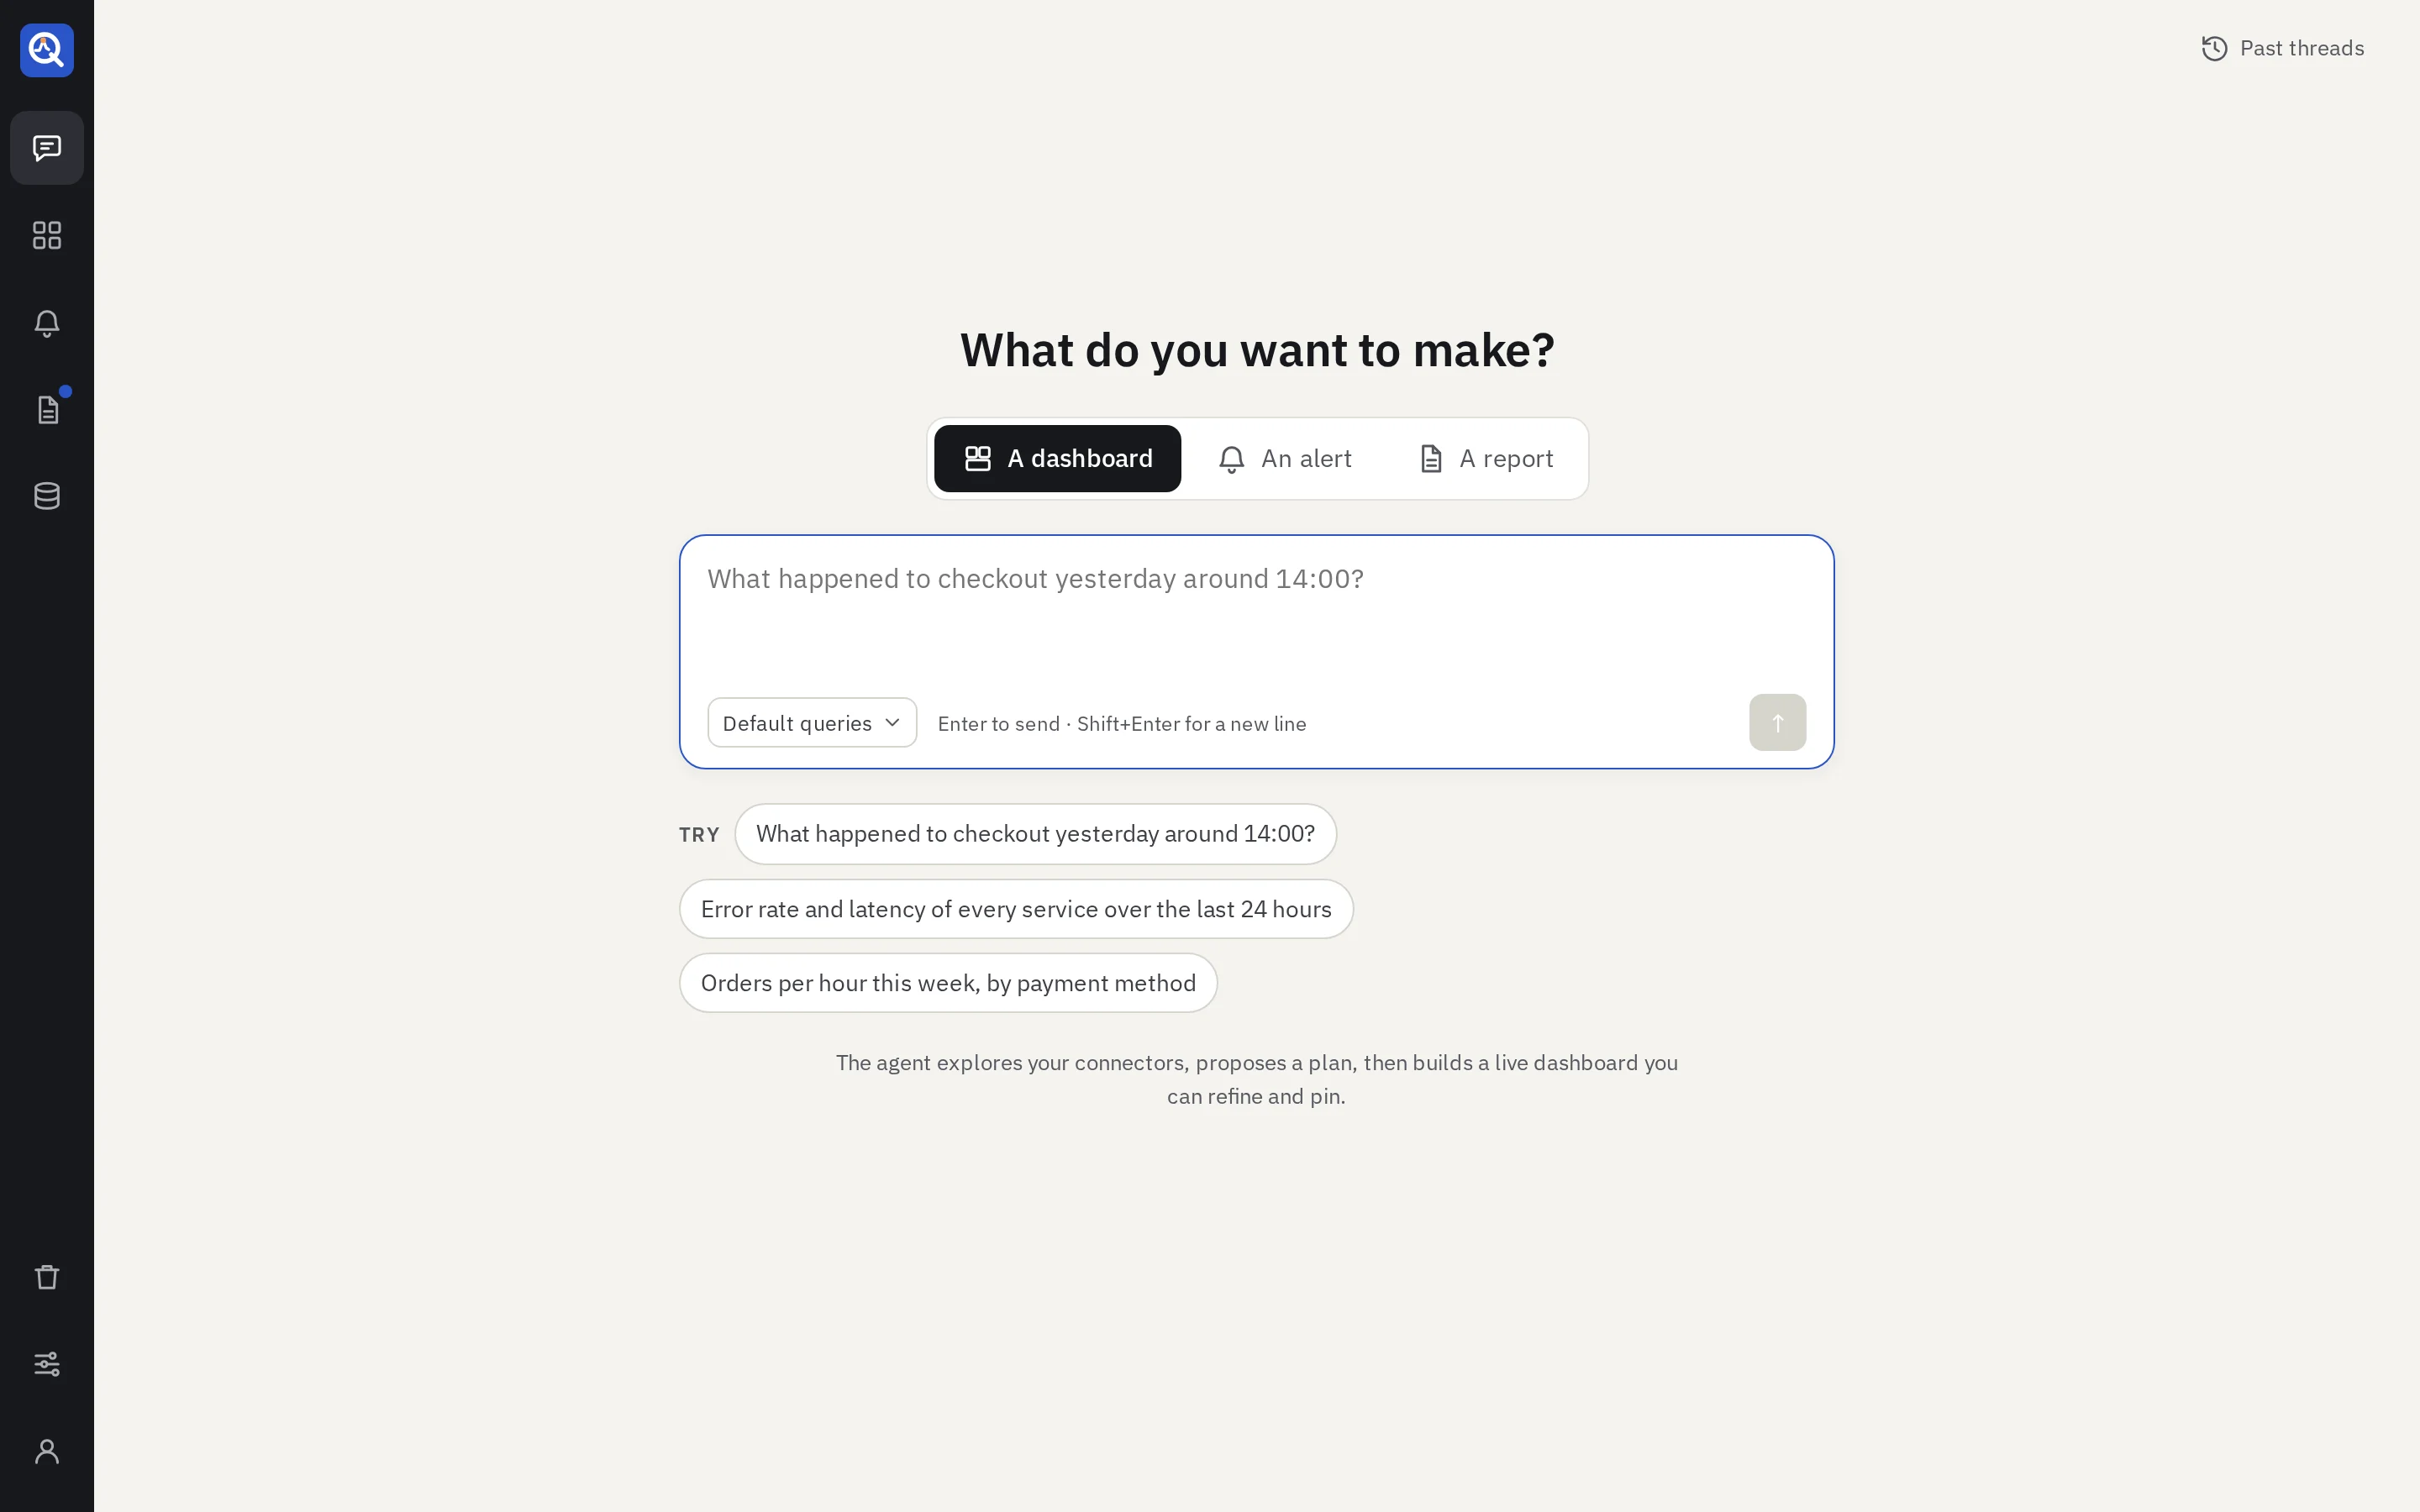
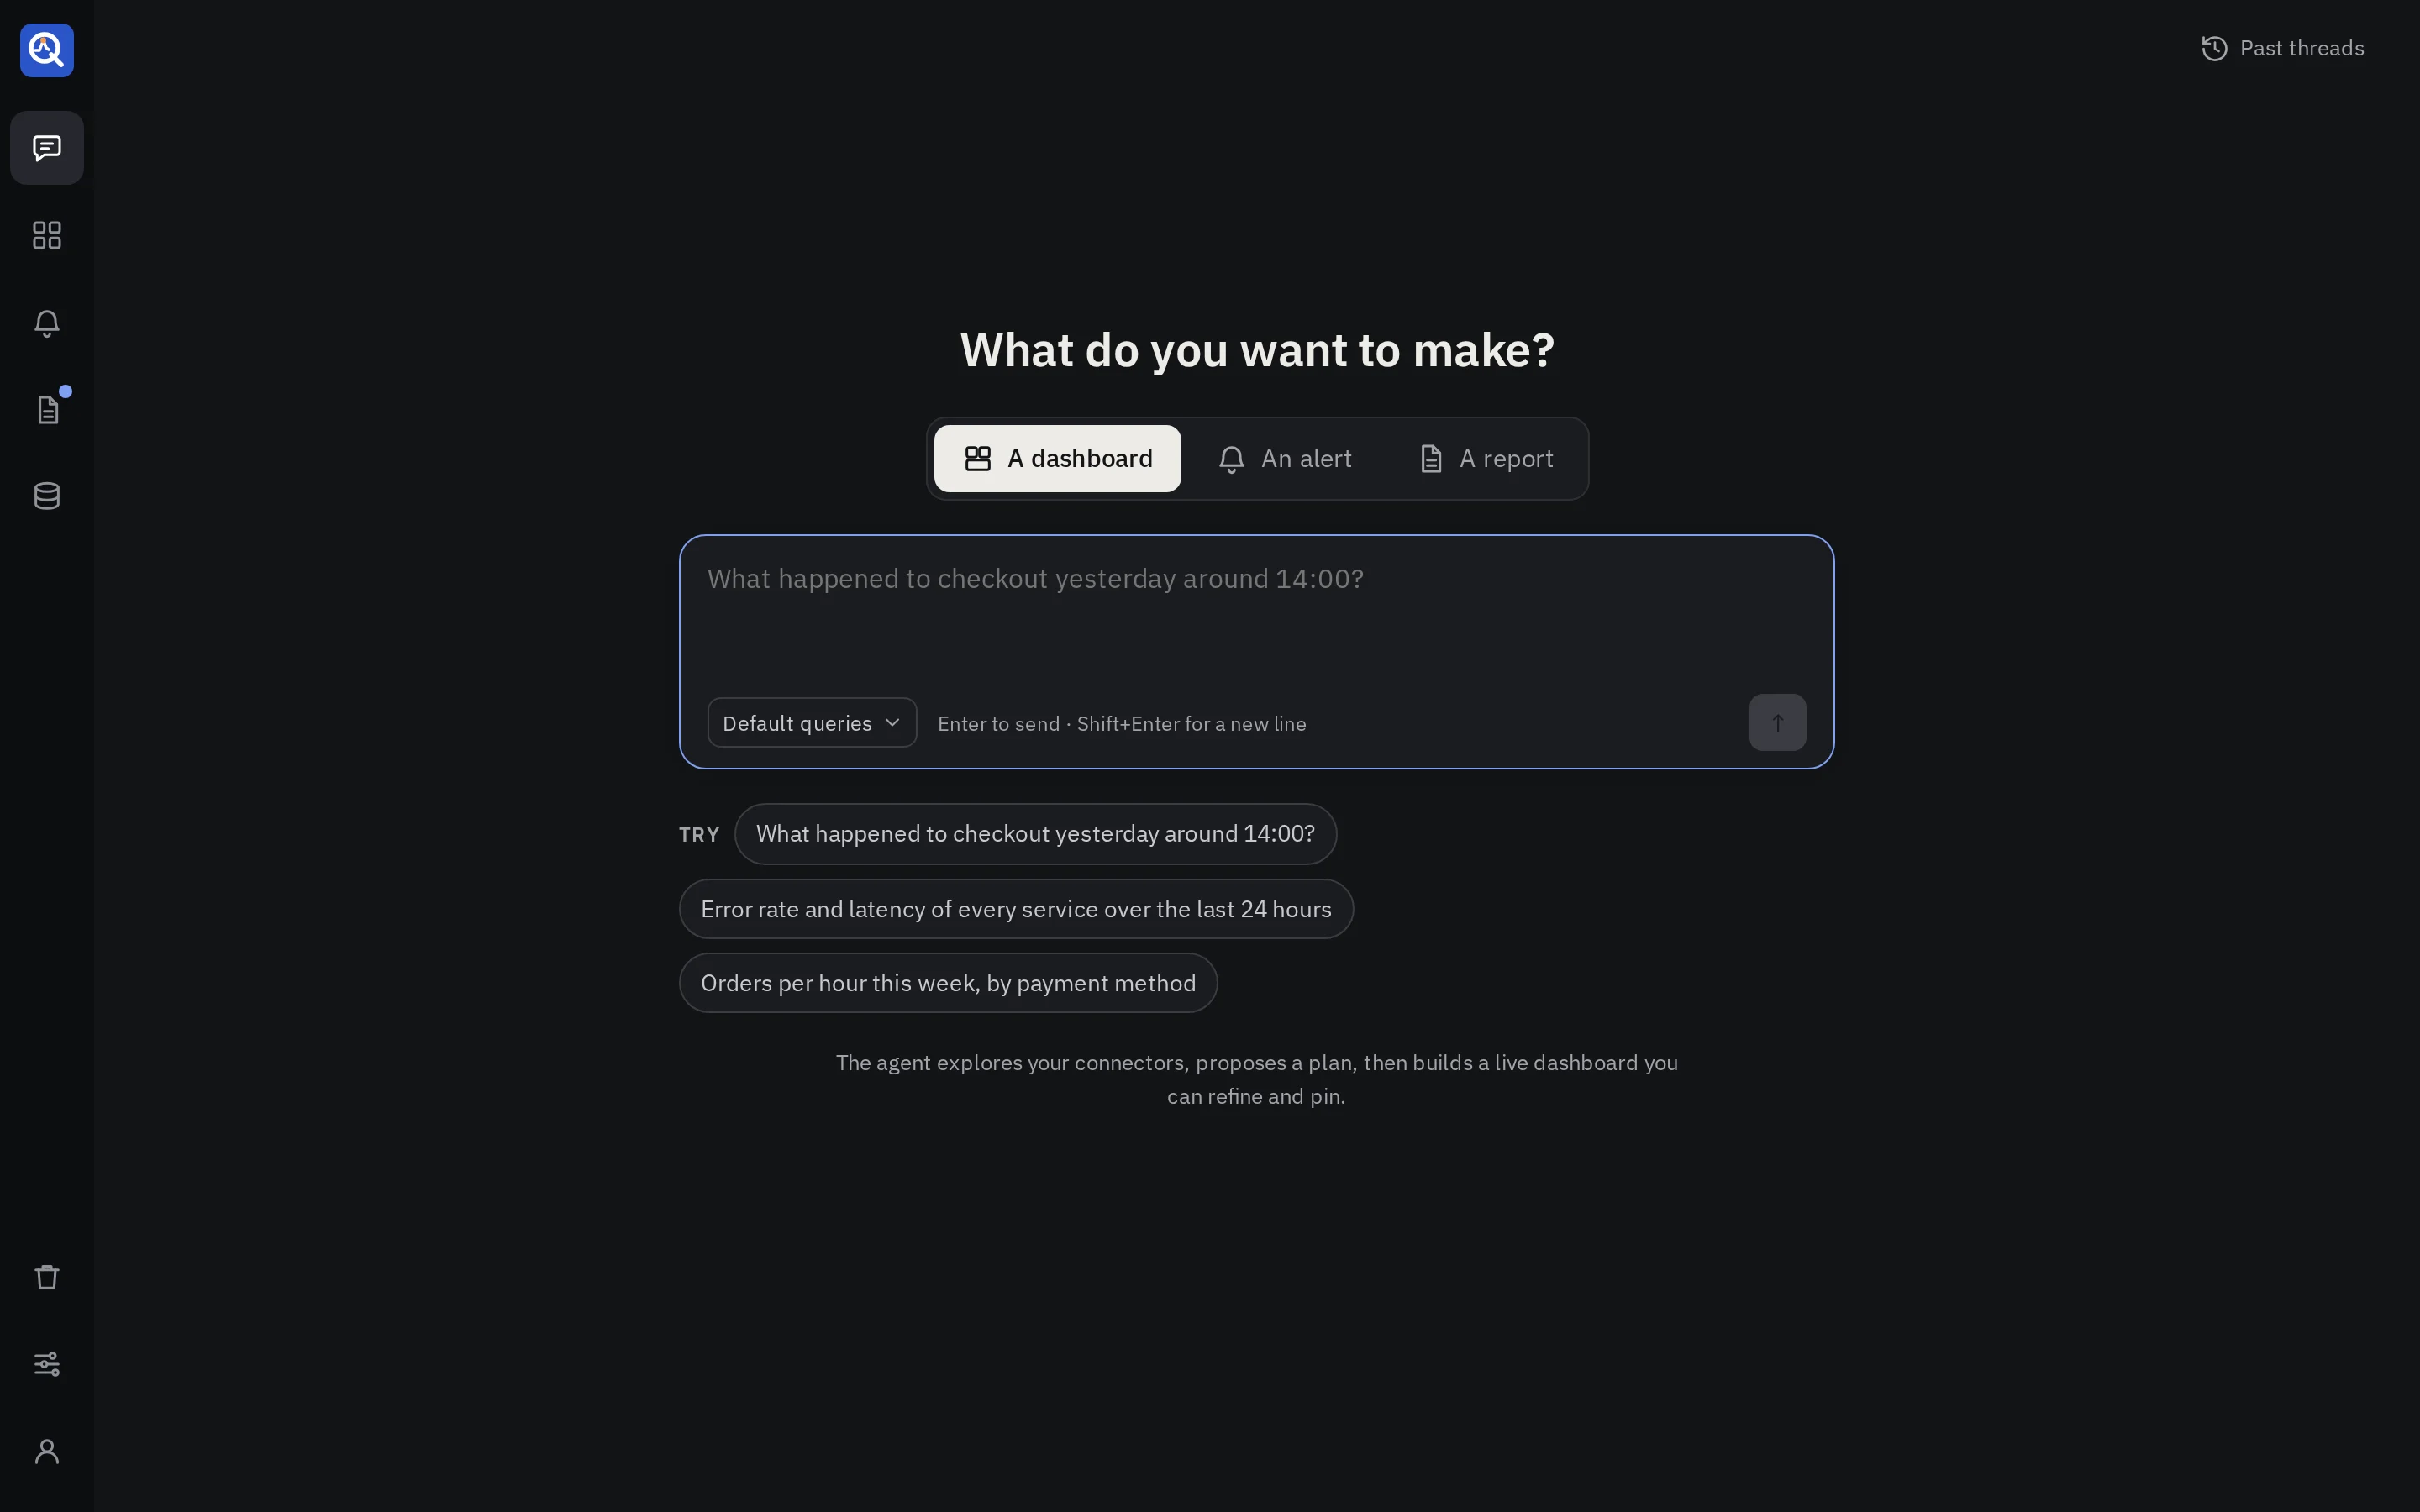
- What do you want to make? Keep A dashboard. The same box starts an alert or a report; a thread makes one kind and keeps it.
- The model. When an admin set up more than one provider, the menu picks the one this thread runs on.
- Queries. Default queries lets the agent use the query builders and saved queries an admin switched on. Choose queries… narrows them for this thread. Free style lets it write raw queries only. Builders give fewer tokens and fewer broken panels; see Queries and charts.
- The examples under the box fill it with a request to start from.
Write as you would to a colleague. Name the time (“yesterday around 14:00”, “the last 30 days”), what to compare and how to split it. Times are read in your browser’s time zone.
Already answered?
Before it plans, quanthea searches the library for pinned dashboards that may answer the same question, with no model. If one fits, Open it, or Start from this: a copy opens in the thread, ready for changes, and starting from one uses no model. Otherwise, Build a new one.
The plan
The agent reads your sources’ schemas within each source’s access level, then proposes a plan: each panel it will build, what it shows and from which source. Nothing runs against your data until you approve.
- Approve & build starts the build.
- Edit plan, or a reply in the box, changes it. The agent proposes a new one.
- A plan for an existing dashboard lists its changes: CHANGED, NEW, REMOVED, and how many panels stay the same. While the plan waits, the draft previews it: changed panels outlined in orange, removed ones dashed red, new ones as dashed blue placeholders.
An admin can turn on Show the queries in a plan (Settings → Model), so a plan also shows the query each panel will run. Plans then take longer and cost more.
The build
The agent writes each panel as data and a chart. quanthea writes the queries from builders where it can, test-runs every one against your source, and checks the chart fits its data. A panel that fails goes back to the agent with the error.
- A card says when a write did not work: “Not saved · the agent fixes it, try 1 of 3”, with each failing panel and why. A green card says when it was fixed.
- After the repair attempts an admin allows, the build stops and says what still fails. Try again starts over with fresh attempts.
- Each answer shows its tokens and cost under it, and the thread’s total sits in its header.
Refine
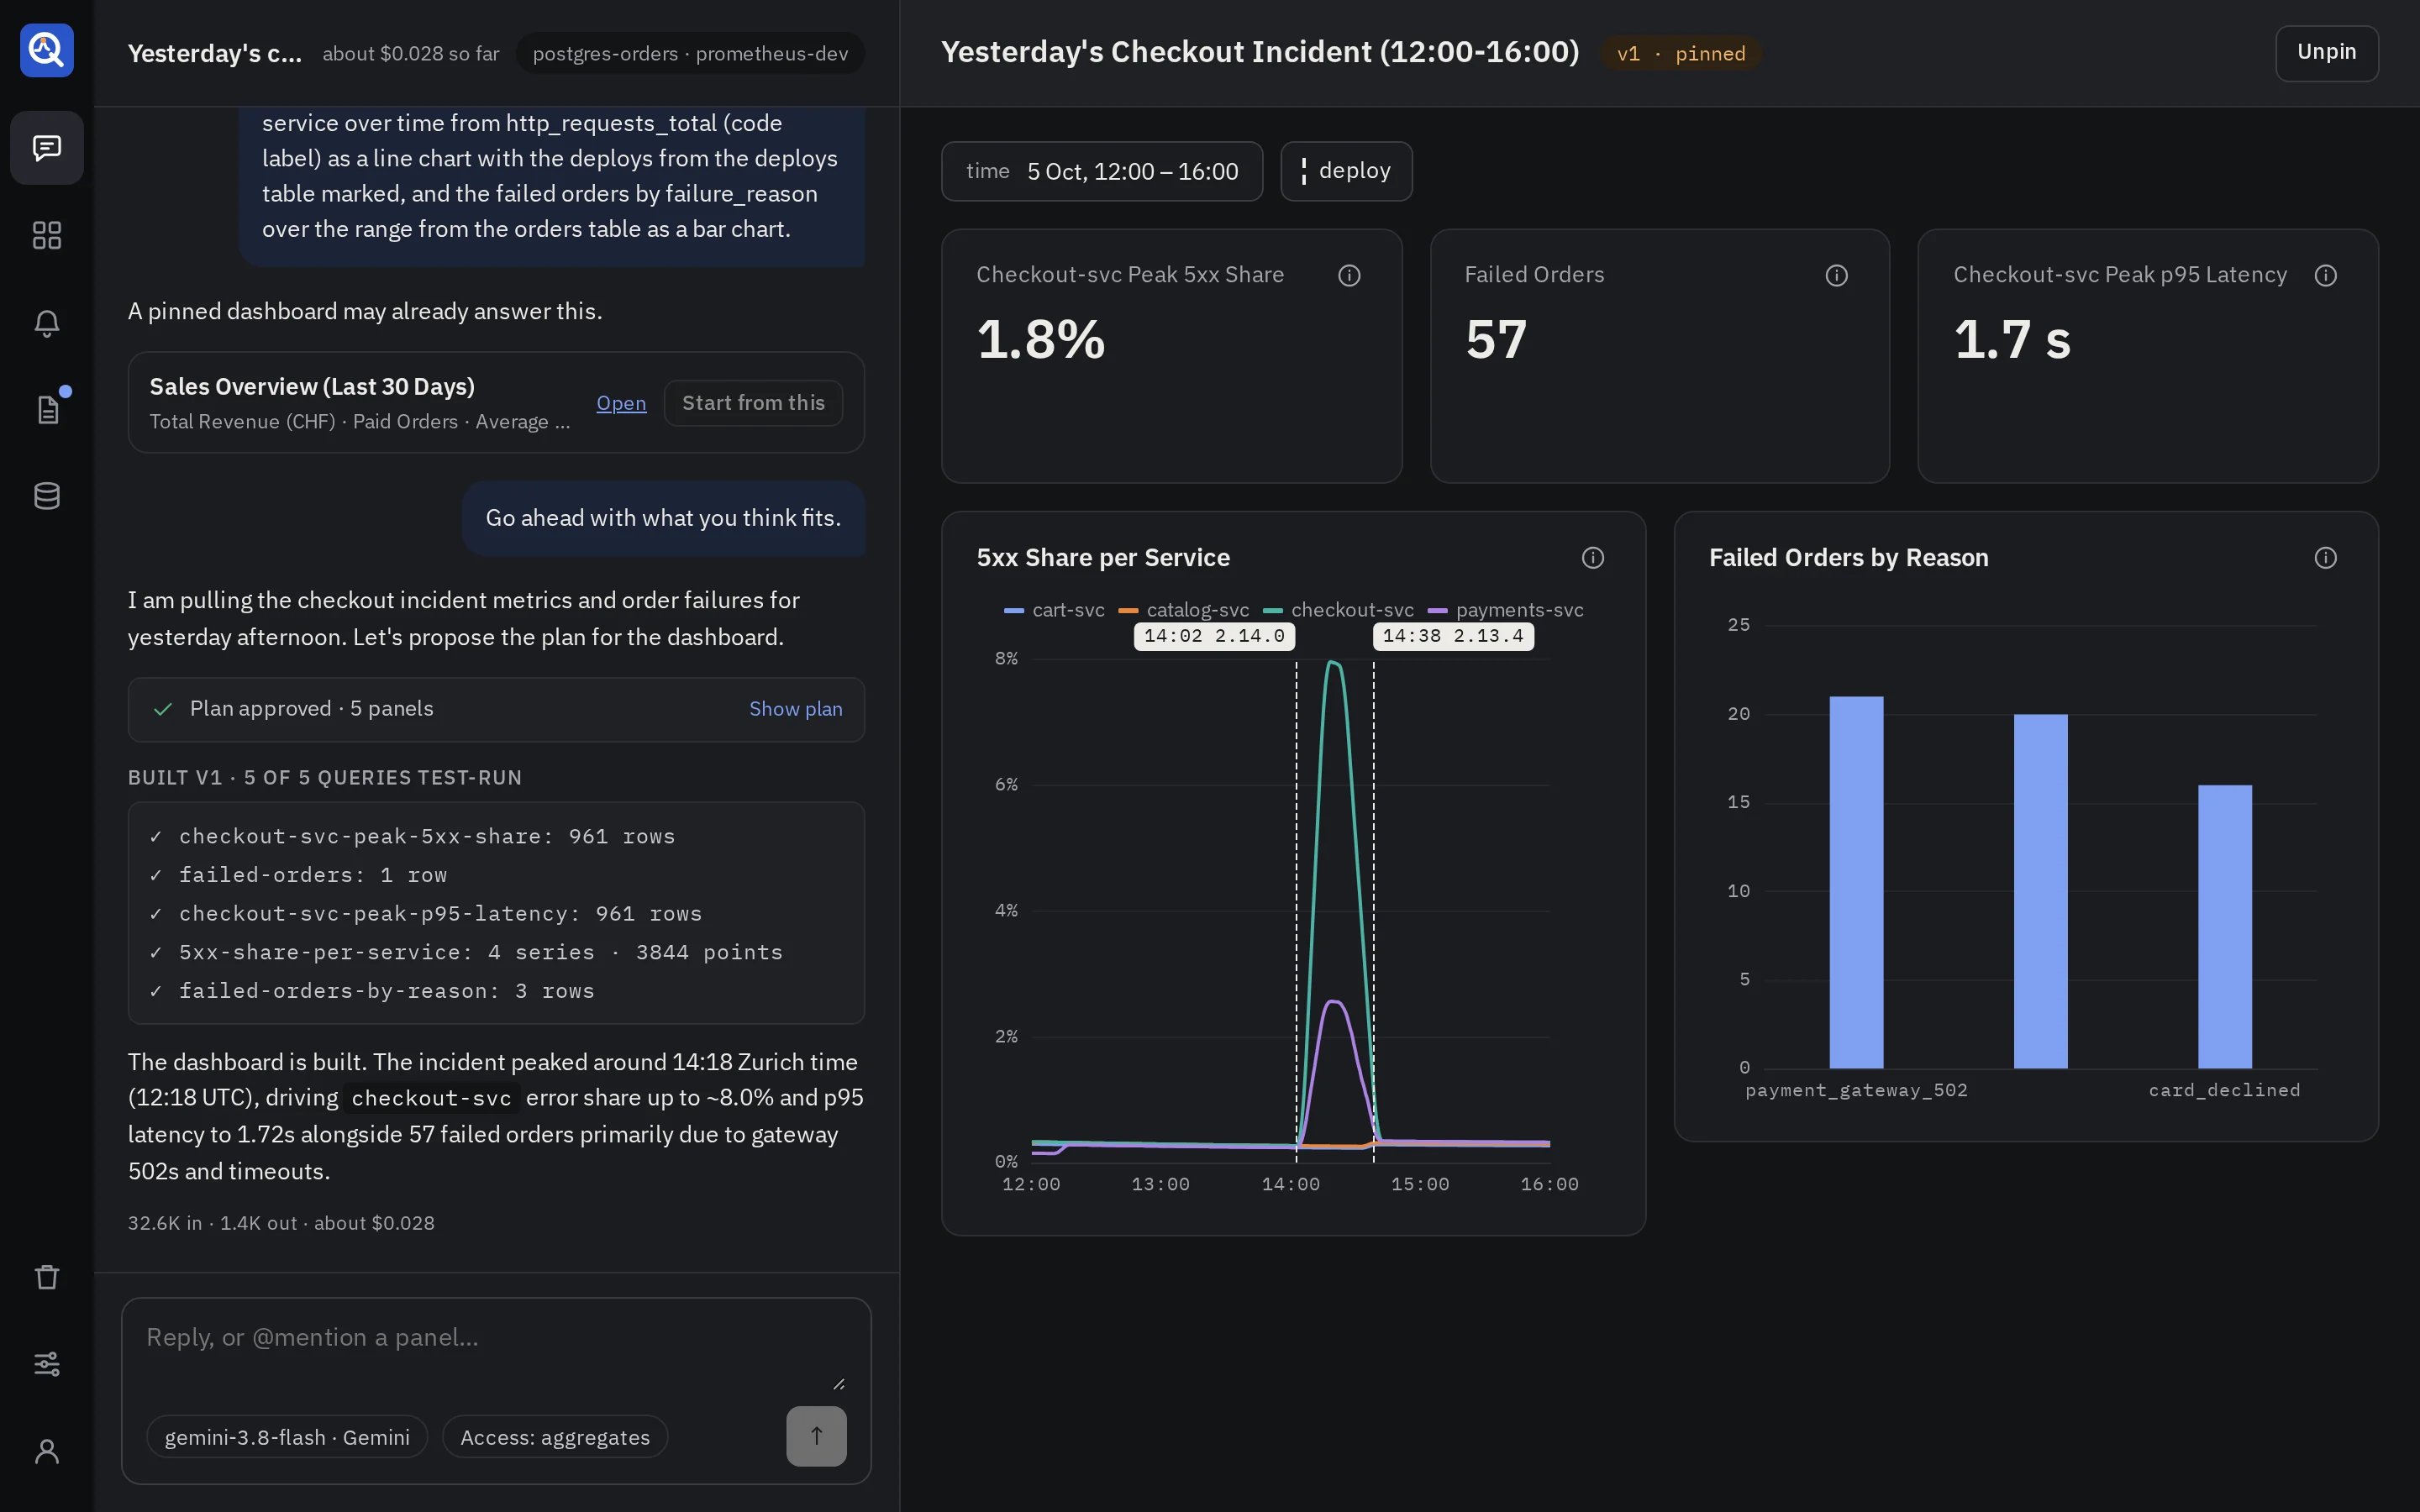
Keep talking in the same thread: “split the latency by route”, “make the error rate a percentage”,
“add the failed orders by reason”. Small changes to existing panels skip the plan. Type @ and a
panel’s title to point at one panel. Each change makes a new version, and a card in the conversation
says what changed.
- Undo on a change card goes back to the version before it, as a new version.
- Compare opens the version before the change in the draft pane, to look at it again.
- The draft pane shows the latest version. Its version menu opens an earlier one; the address keeps it, so a reload or a shared link shows the same.
Pin
Pin puts the version you are looking at in the library. Viewers see only pinned versions.
- Pinning test-runs every panel again. A dashboard with a failing query can’t be pinned, and the refusal names each failing query.
- The model writes a one-line description and a few tags for the library. If it is slow or not set up, the dashboard is pinned without them.
- The thread can keep adding versions after that. They stay drafts until you pin one.
- Unpin takes the dashboard out of the library. Viewers no longer open it; editors still do.
Only the thread’s owner and admins pin and unpin a dashboard built in a thread.
Use a dashboard
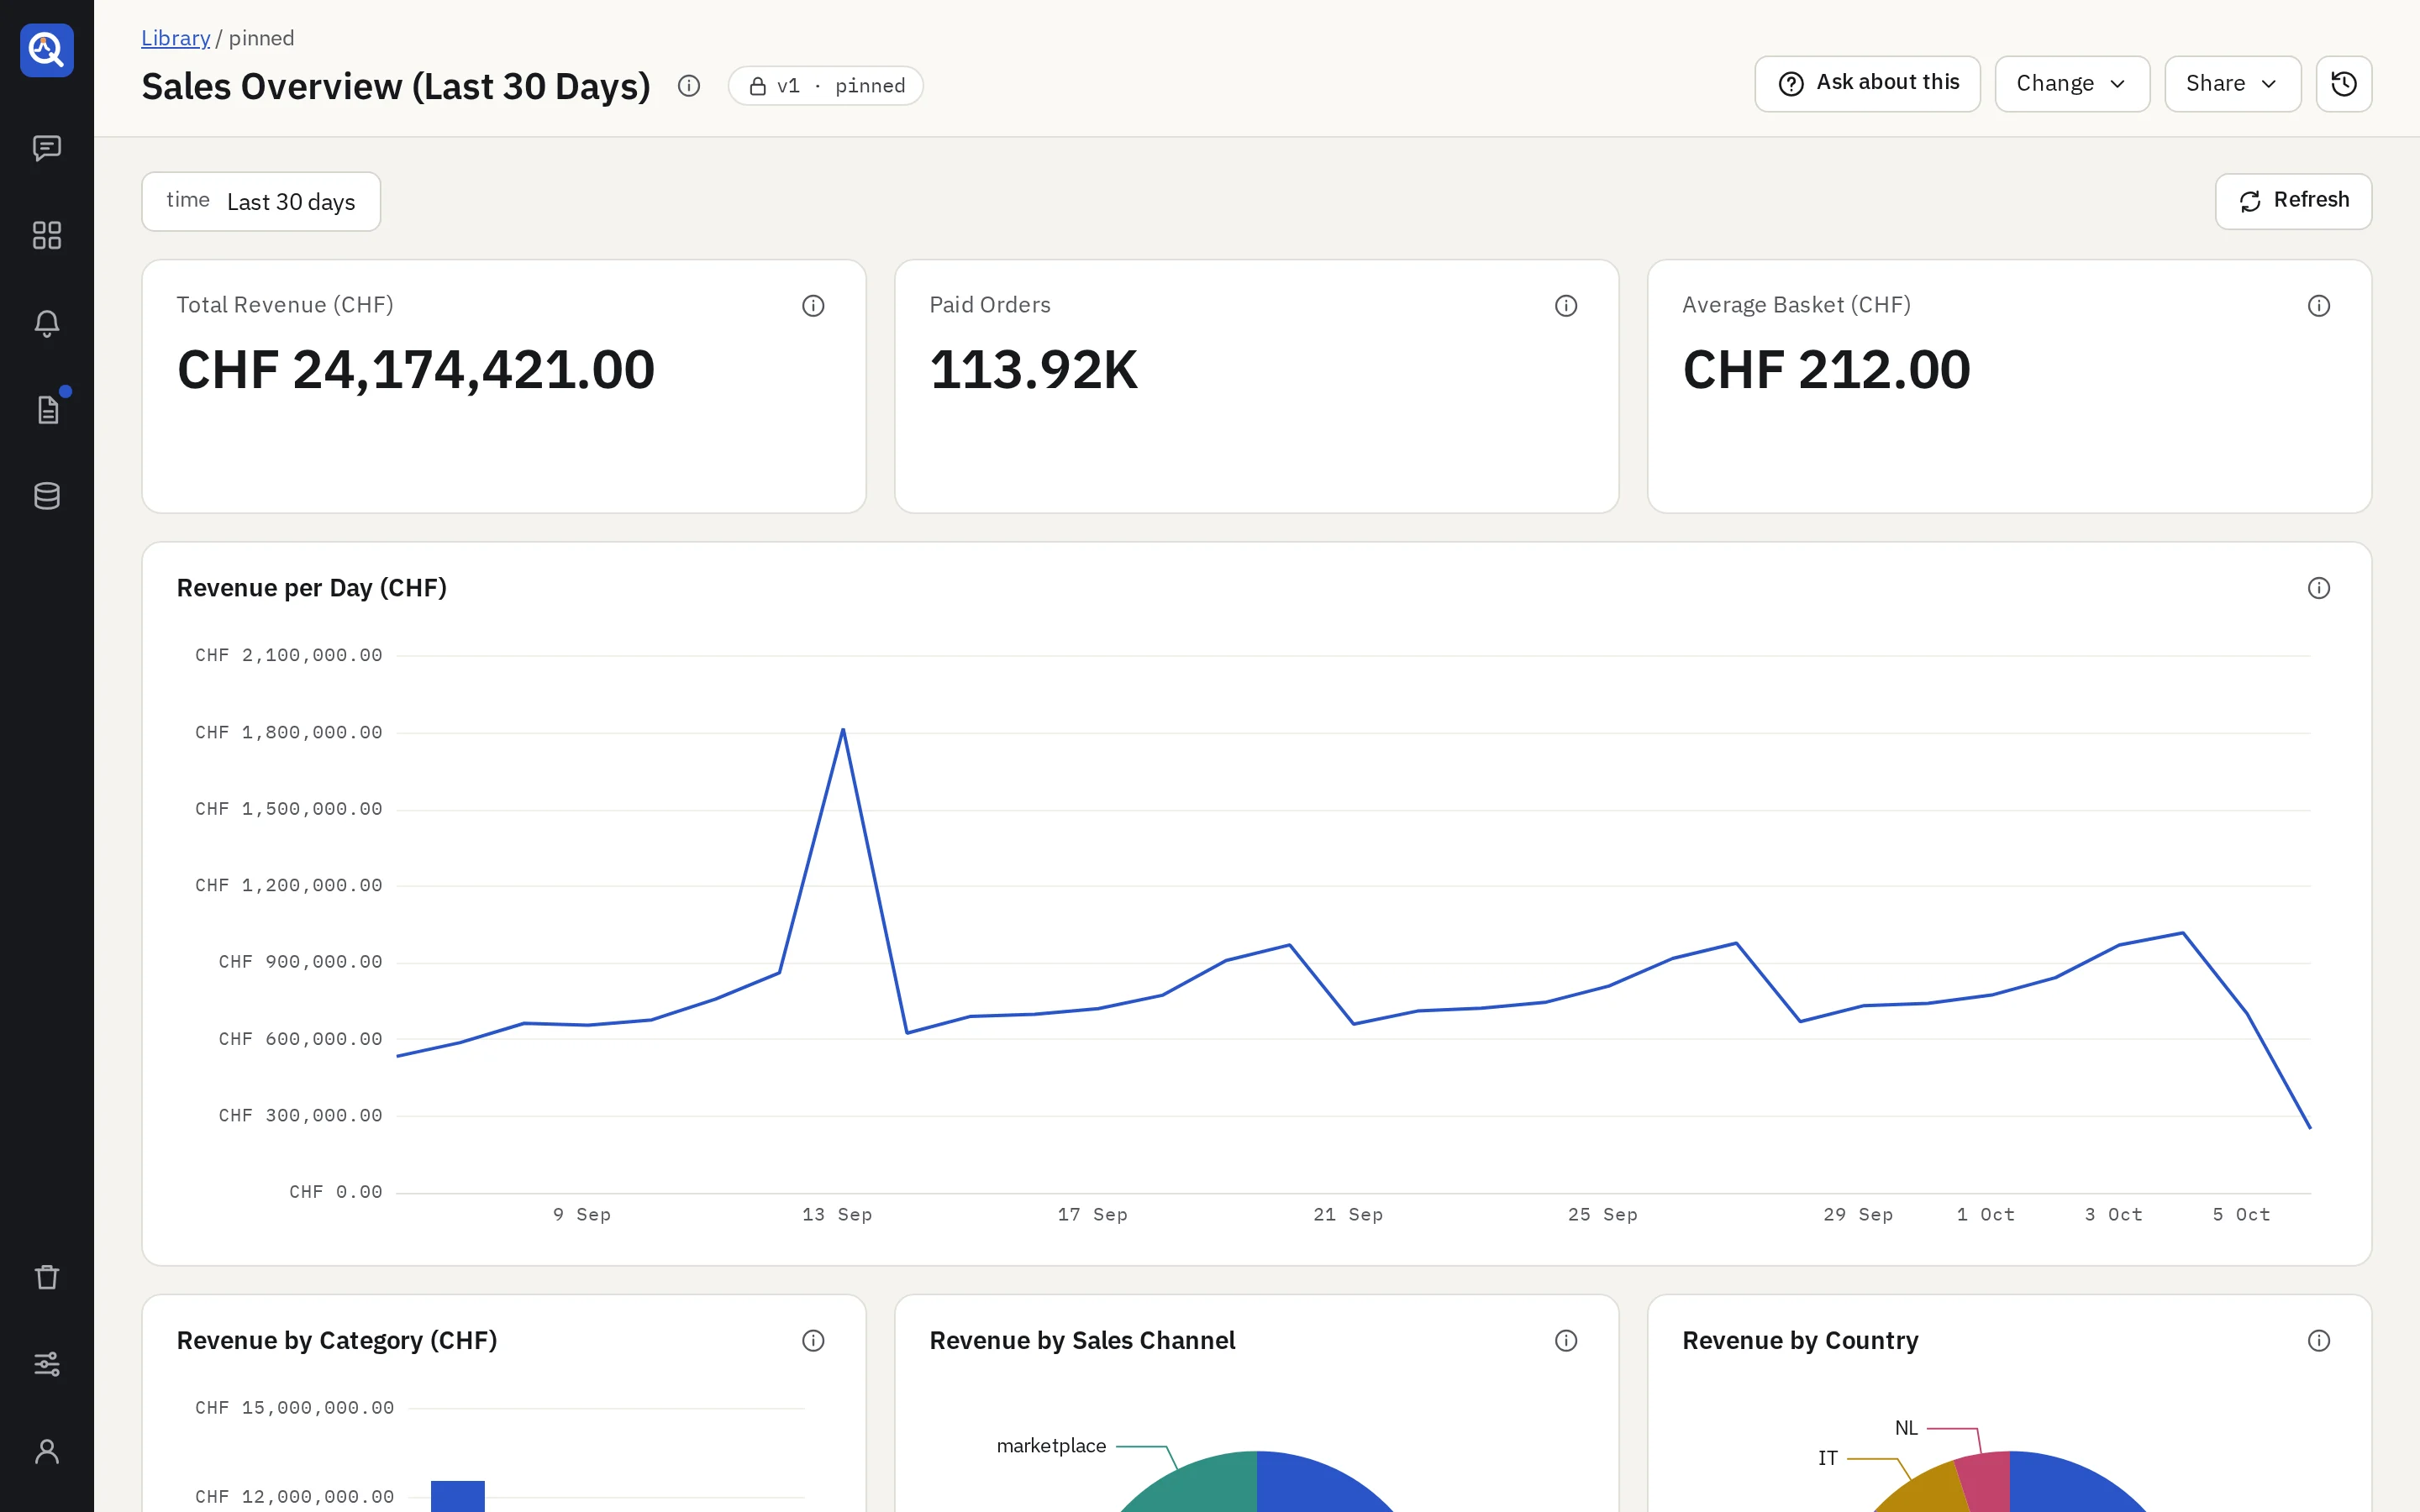
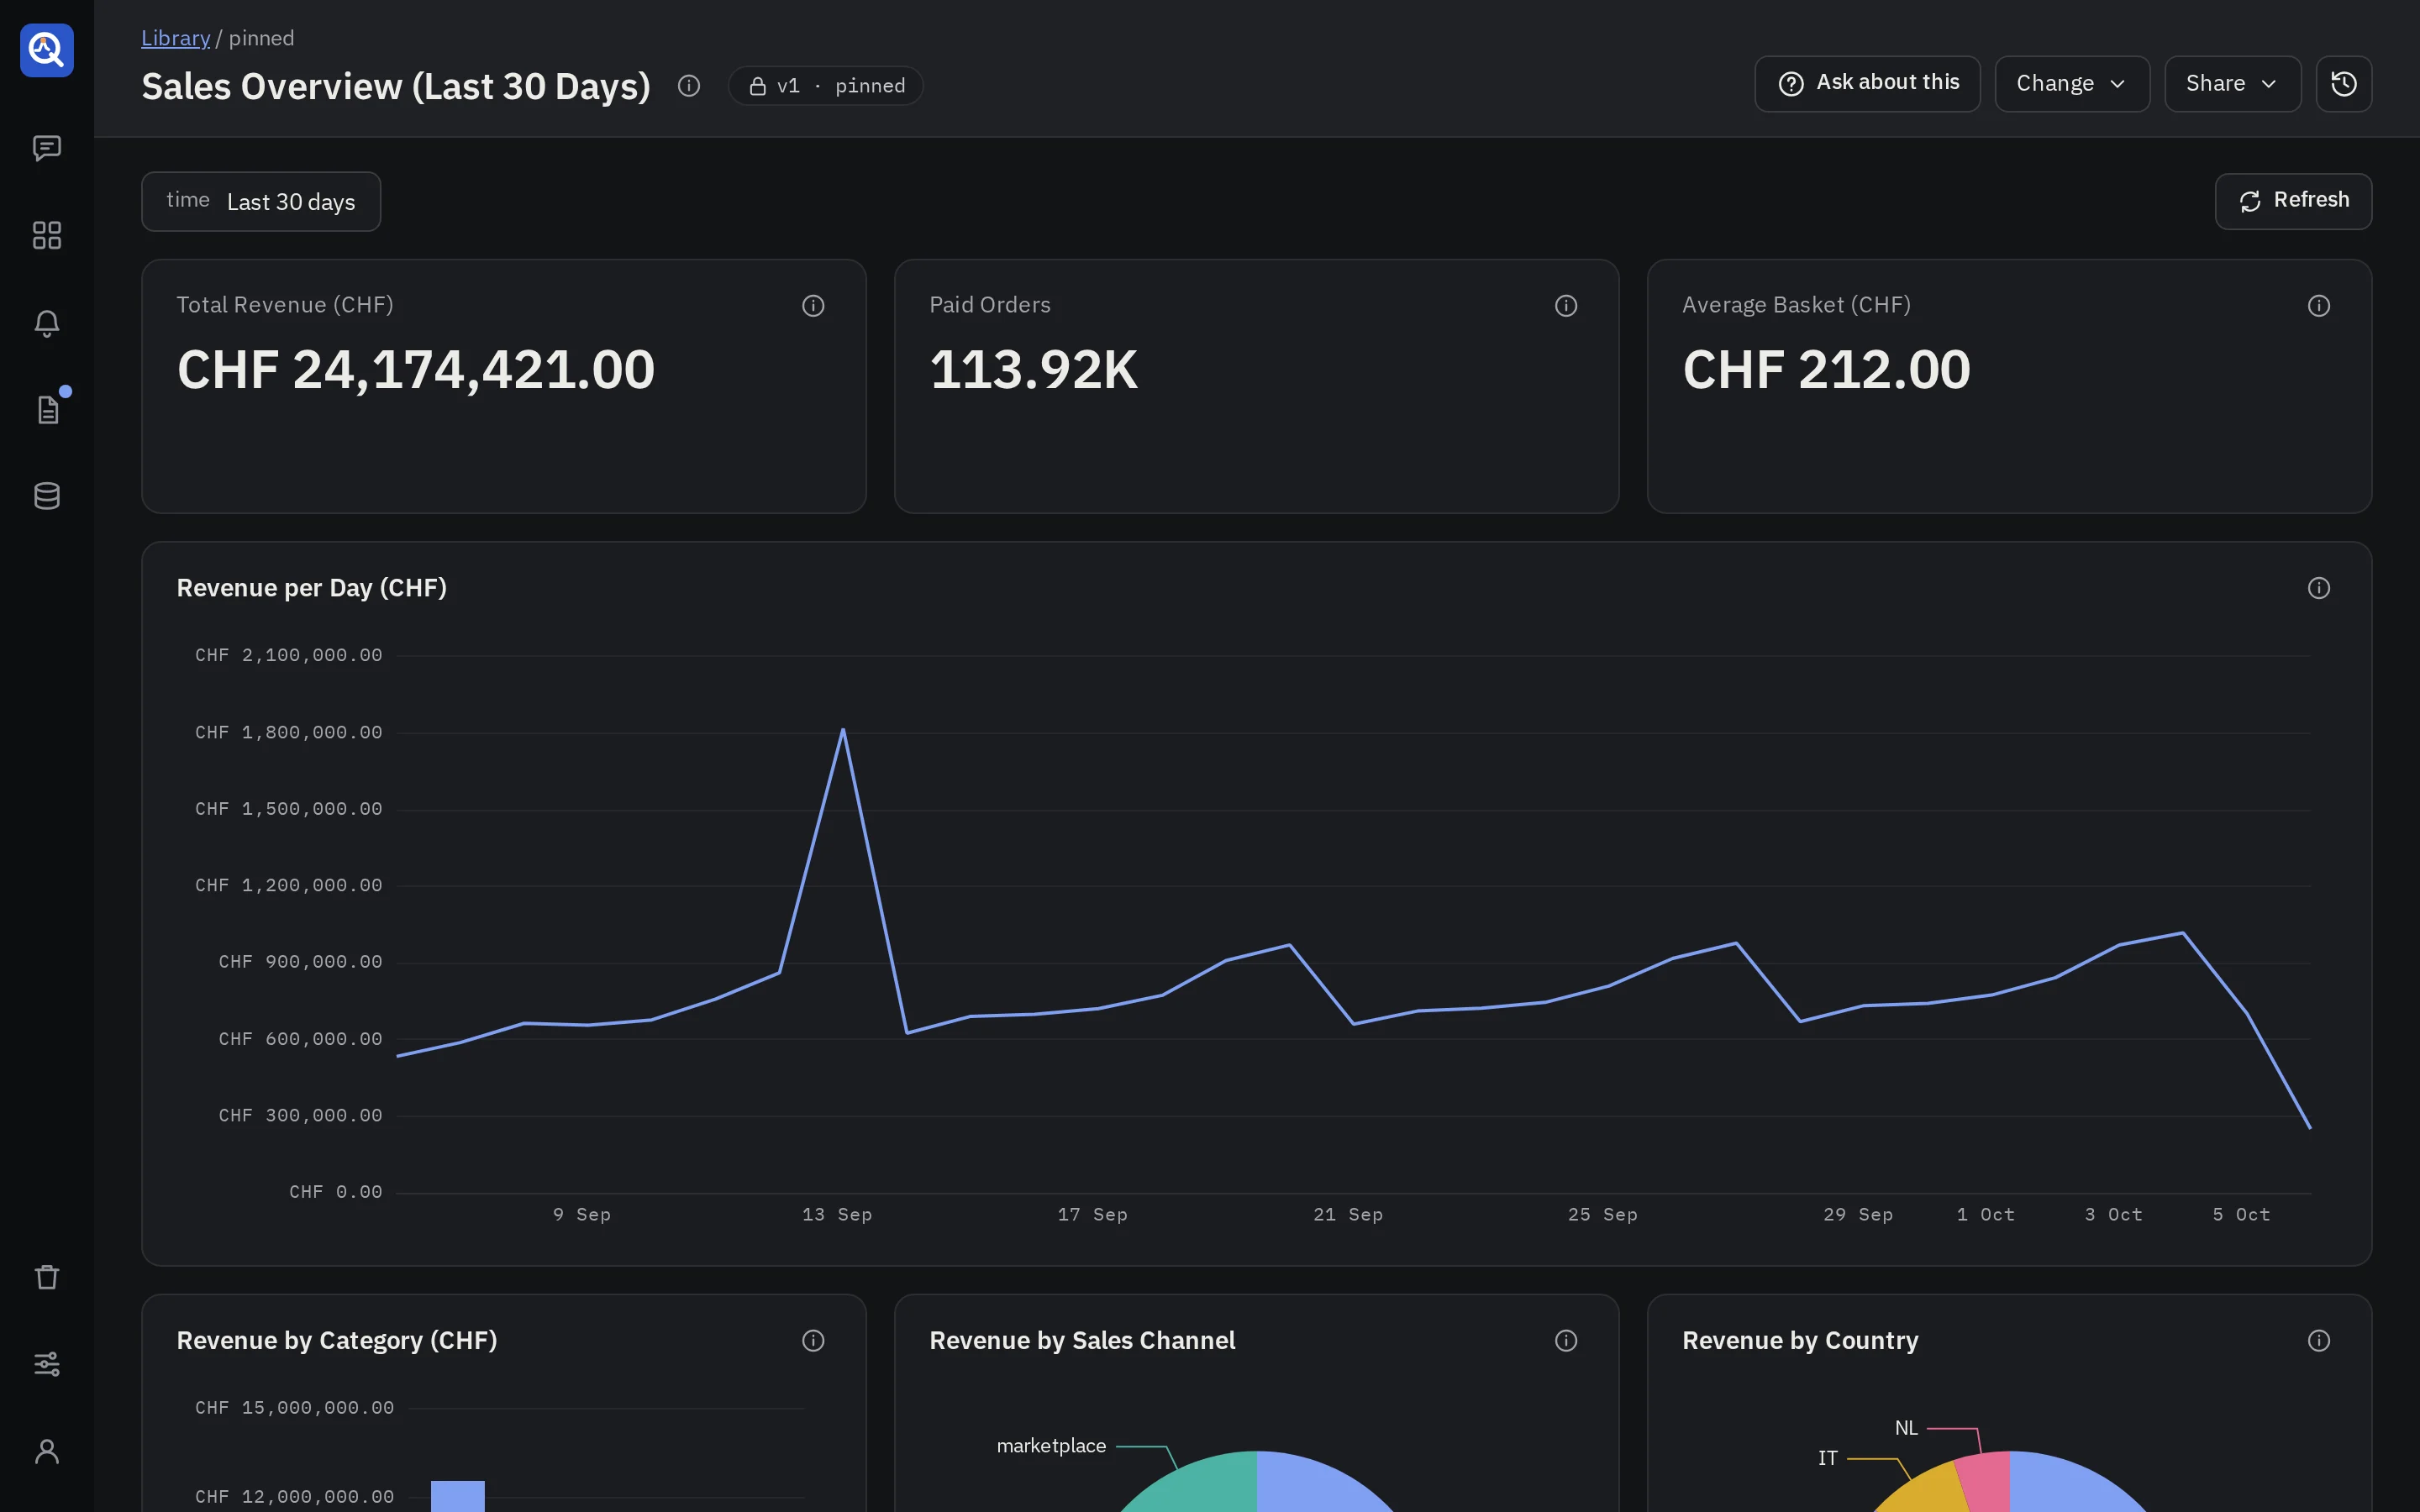
- Time range and variables. The row above the panels holds the time range and the dashboard’s variables, such as an environment or a service. They live in the address, so a link shares exactly what you see. Changing them runs the panels again and never calls a model.
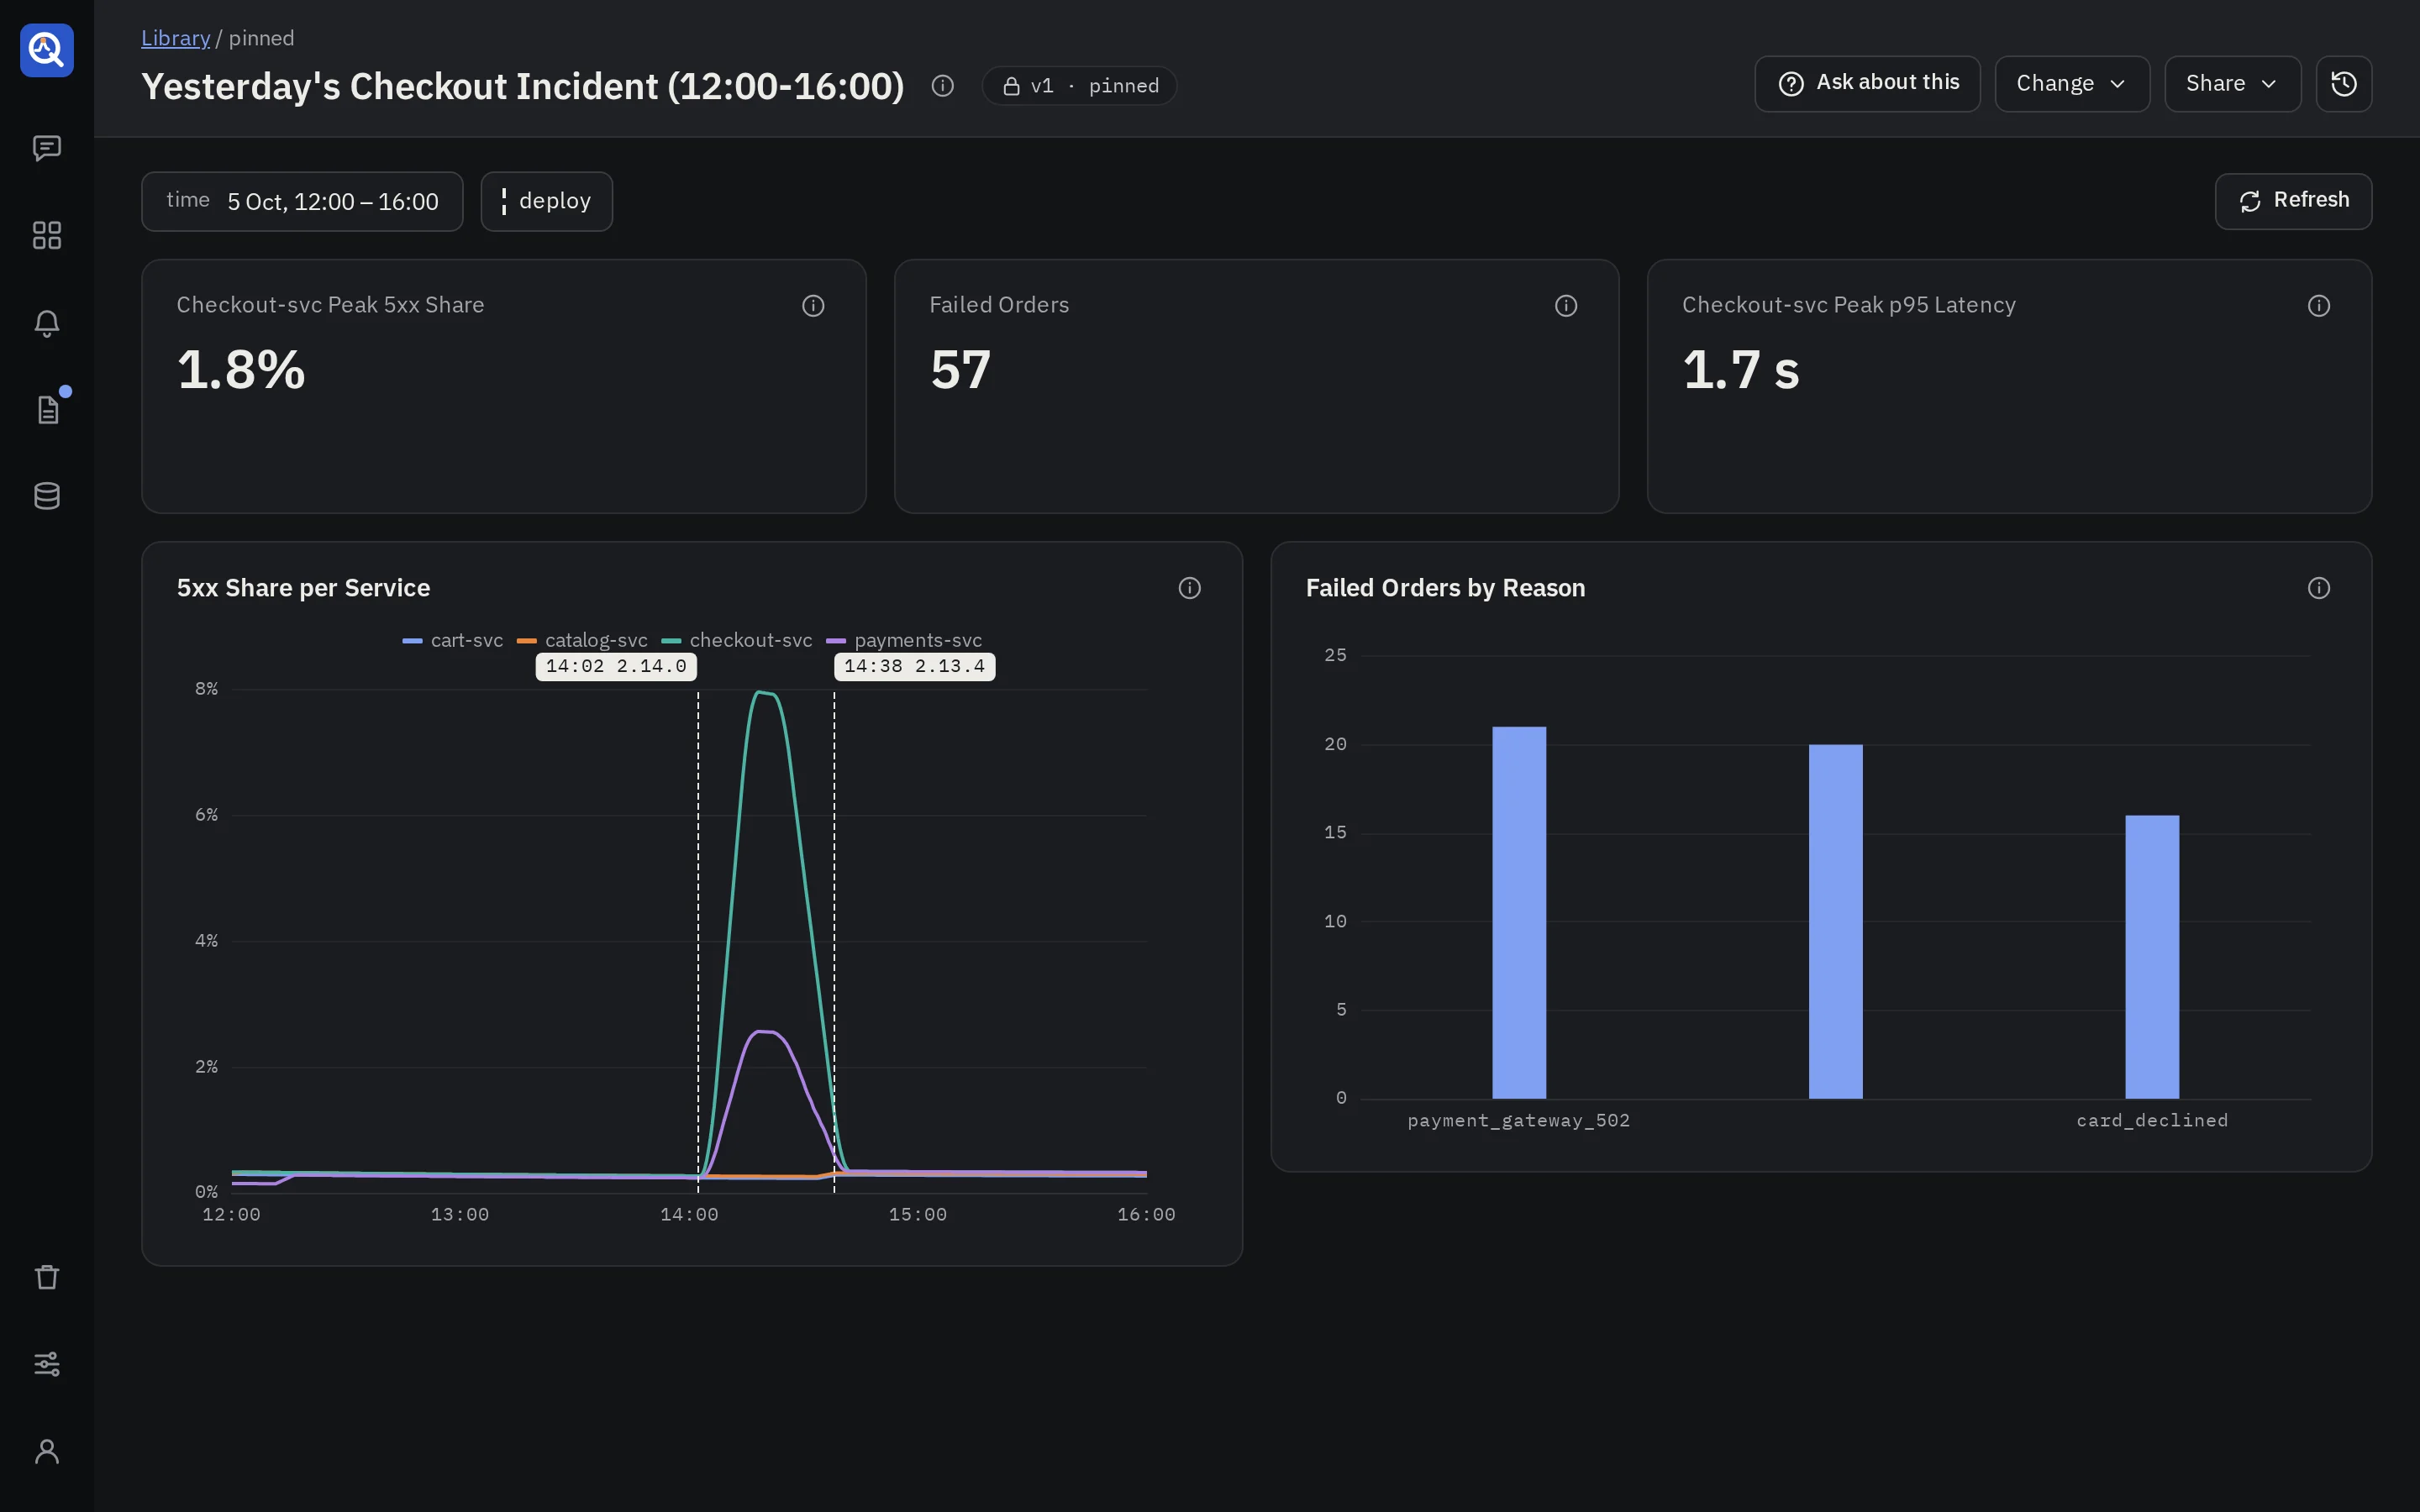
- Markers. Events such as deploys or incidents are dashed lines on time charts, labelled
(
14:02 deploy #481). Each set has a toggle at the end of the variables row. - Refresh runs every panel again. Its tip says how many saved queries ran, against which sources, how long they took, and that no model was called.
- Where a number comes from. Each panel’s info bubble shows its source, the query it runs and the chart that draws it. On a pinned version it also holds the panel’s explanation.
- Alerts on panels. A panel an alert watches shows a state pill, and its time chart draws the alert’s threshold and when it fired.
- About (the info icon by the title) gives the description, the tags and the sources.
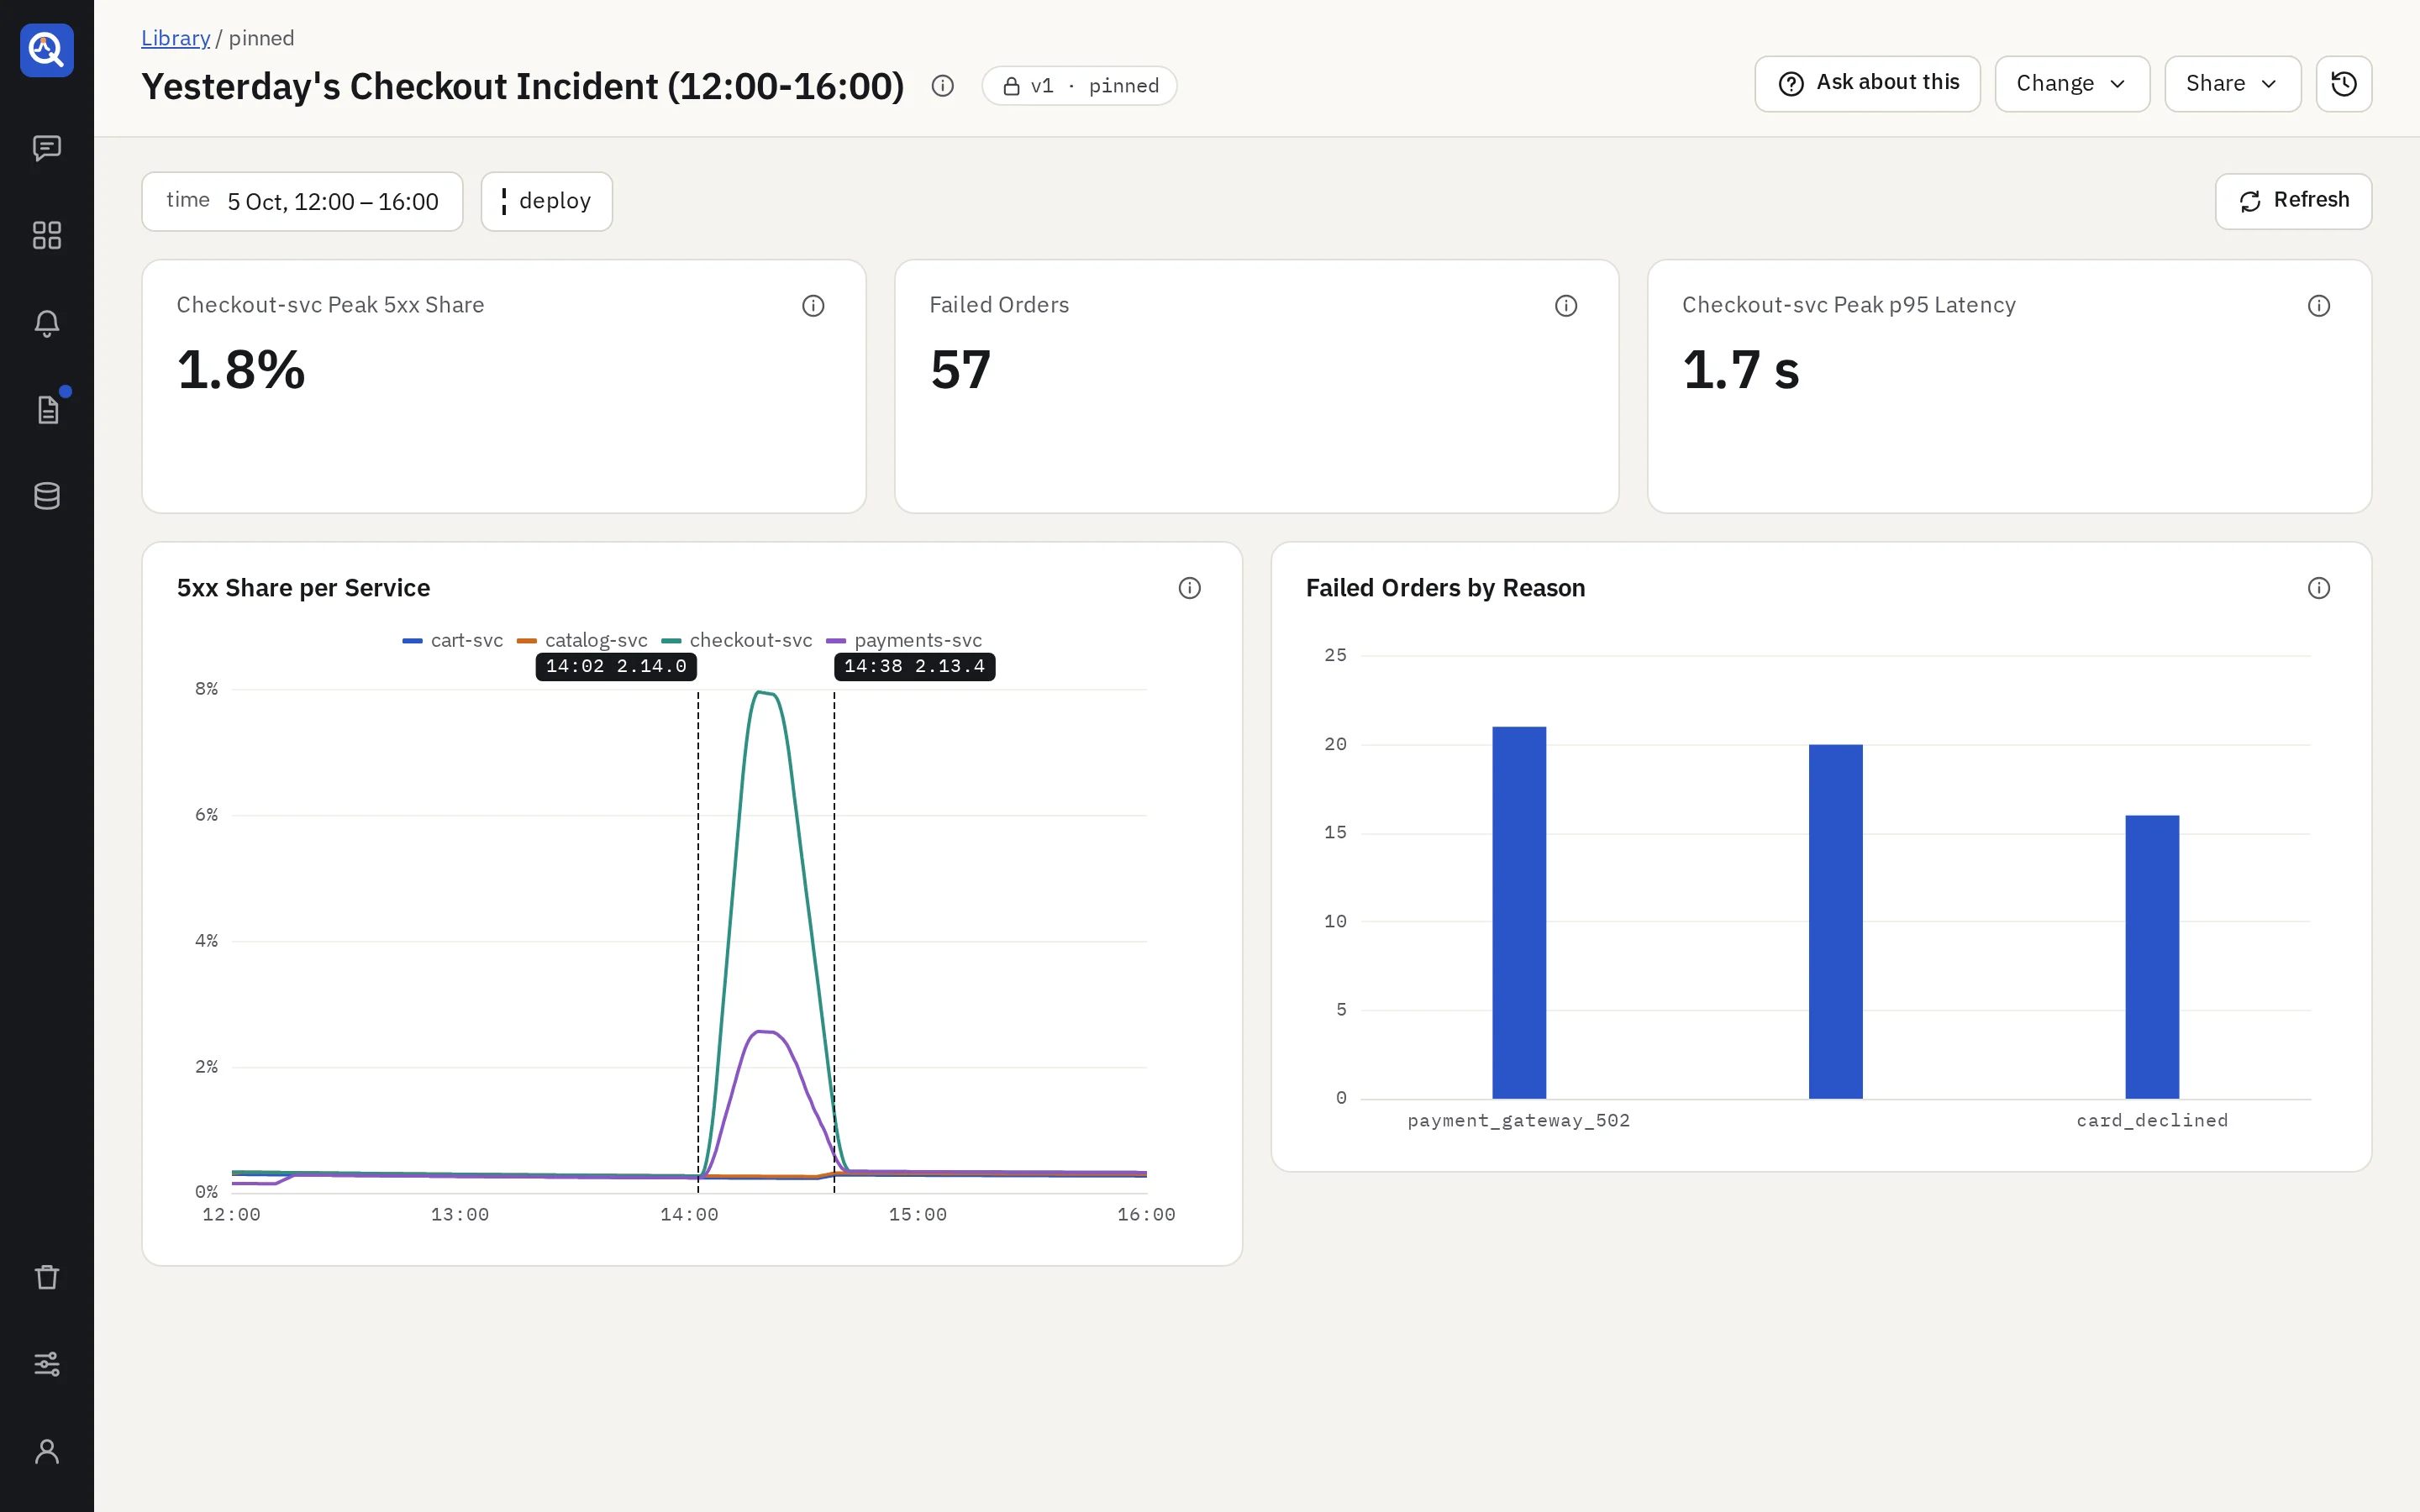
The header’s actions
- Ask about this opens the side panel to ask questions about what the dashboard shows.
- Change (editors):
- Edit with the agent opens the thread that built the dashboard, or starts one when it has none.
- New dashboard from this copies the version you see into a new thread, ready for changes. The original stays as it is.
- Share: Copy link, and for editors, snapshots.
- Versions lists every version, newest first: when it was made, whether it is pinned, and what changed. Editors pin any of them from there, an earlier one included, which rolls the library back. Versions are never rewritten.
Past threads
Past threads, at the top right of the new thread screen, lists your threads by day, with a search and a filter: All, Live (a pinned dashboard, or an active alert or report) and Drafts.
- Each thread has a button to move it to the bin. A thread whose dashboard is pinned can’t go there: unpin it first.
- With Drafts on, Delete all my drafts moves every draft of yours to the bin at once. Other people’s threads are never touched.
A thread belongs to whoever started it. Admins read anyone’s thread but never write in it.