


Dashboards
A dashboard starts as a conversation. You say what you want to see, the agent proposes a plan, you approve it, and the dashboard builds beside the conversation. You refine it in the same thread and pin the version you want to keep. Pinned dashboards render with no model involved.
Building needs the editor role. Every role reads pinned dashboards.
Start a thread
Open Threads. The question box sits in the middle of the screen.
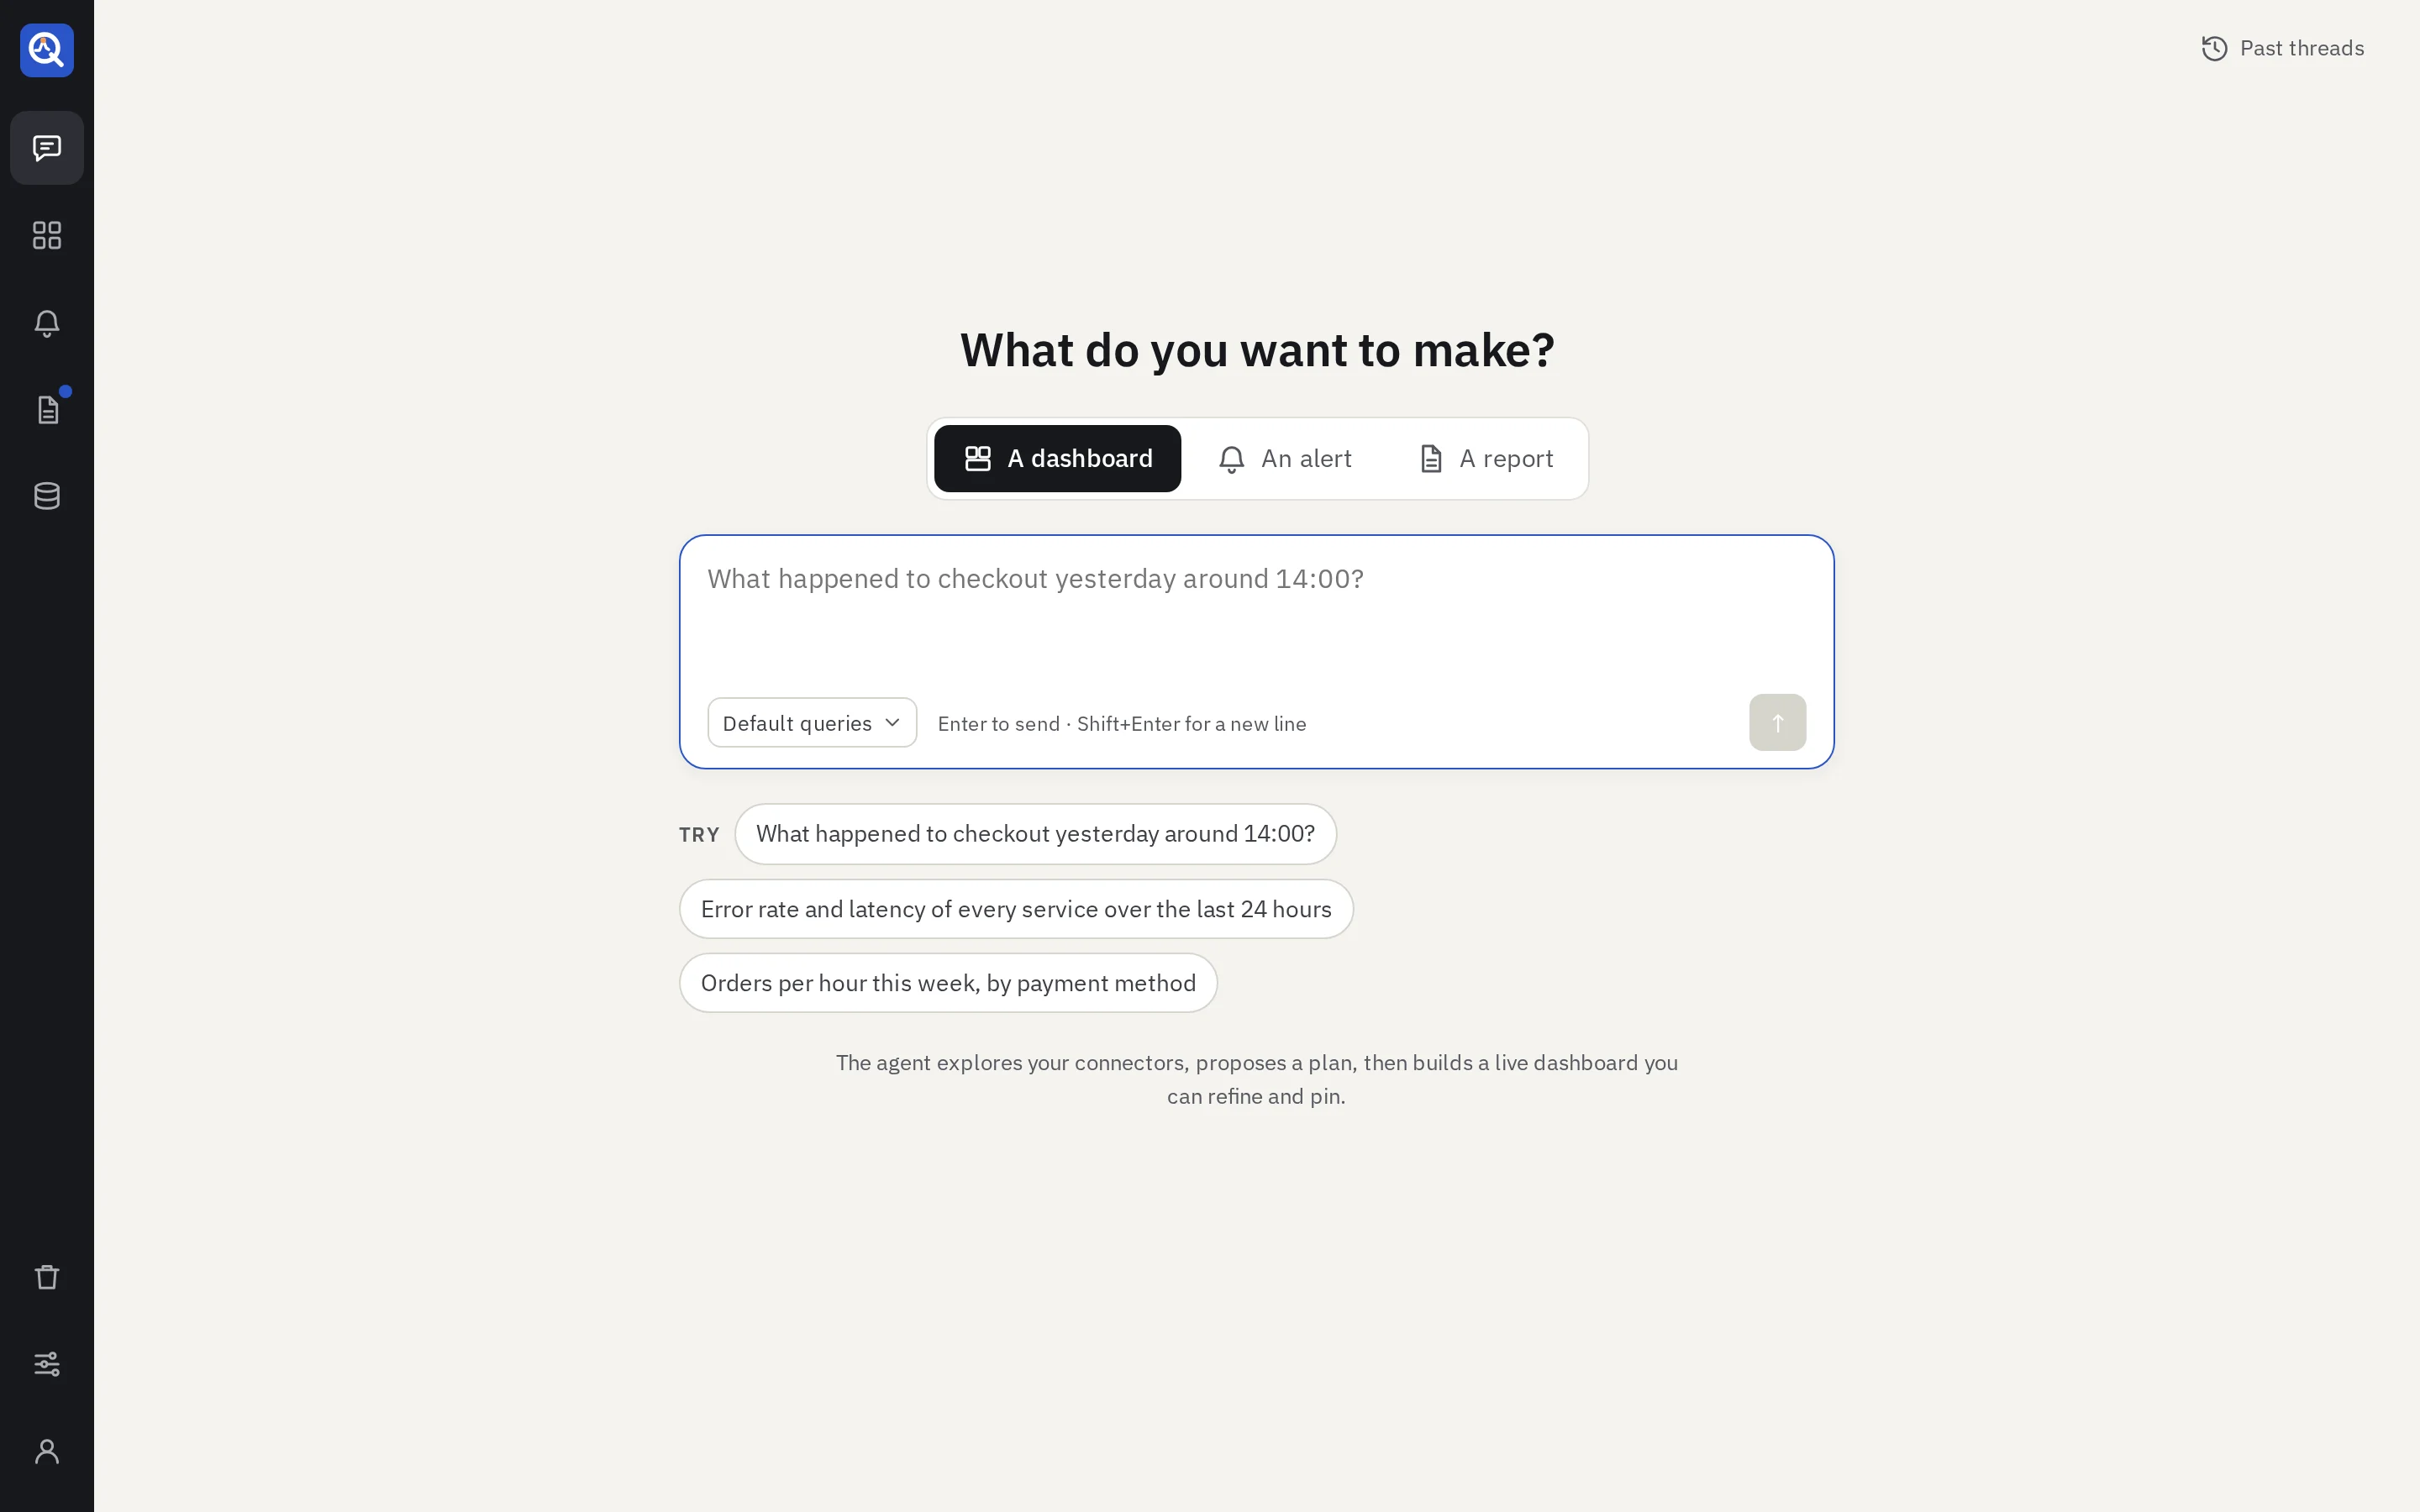
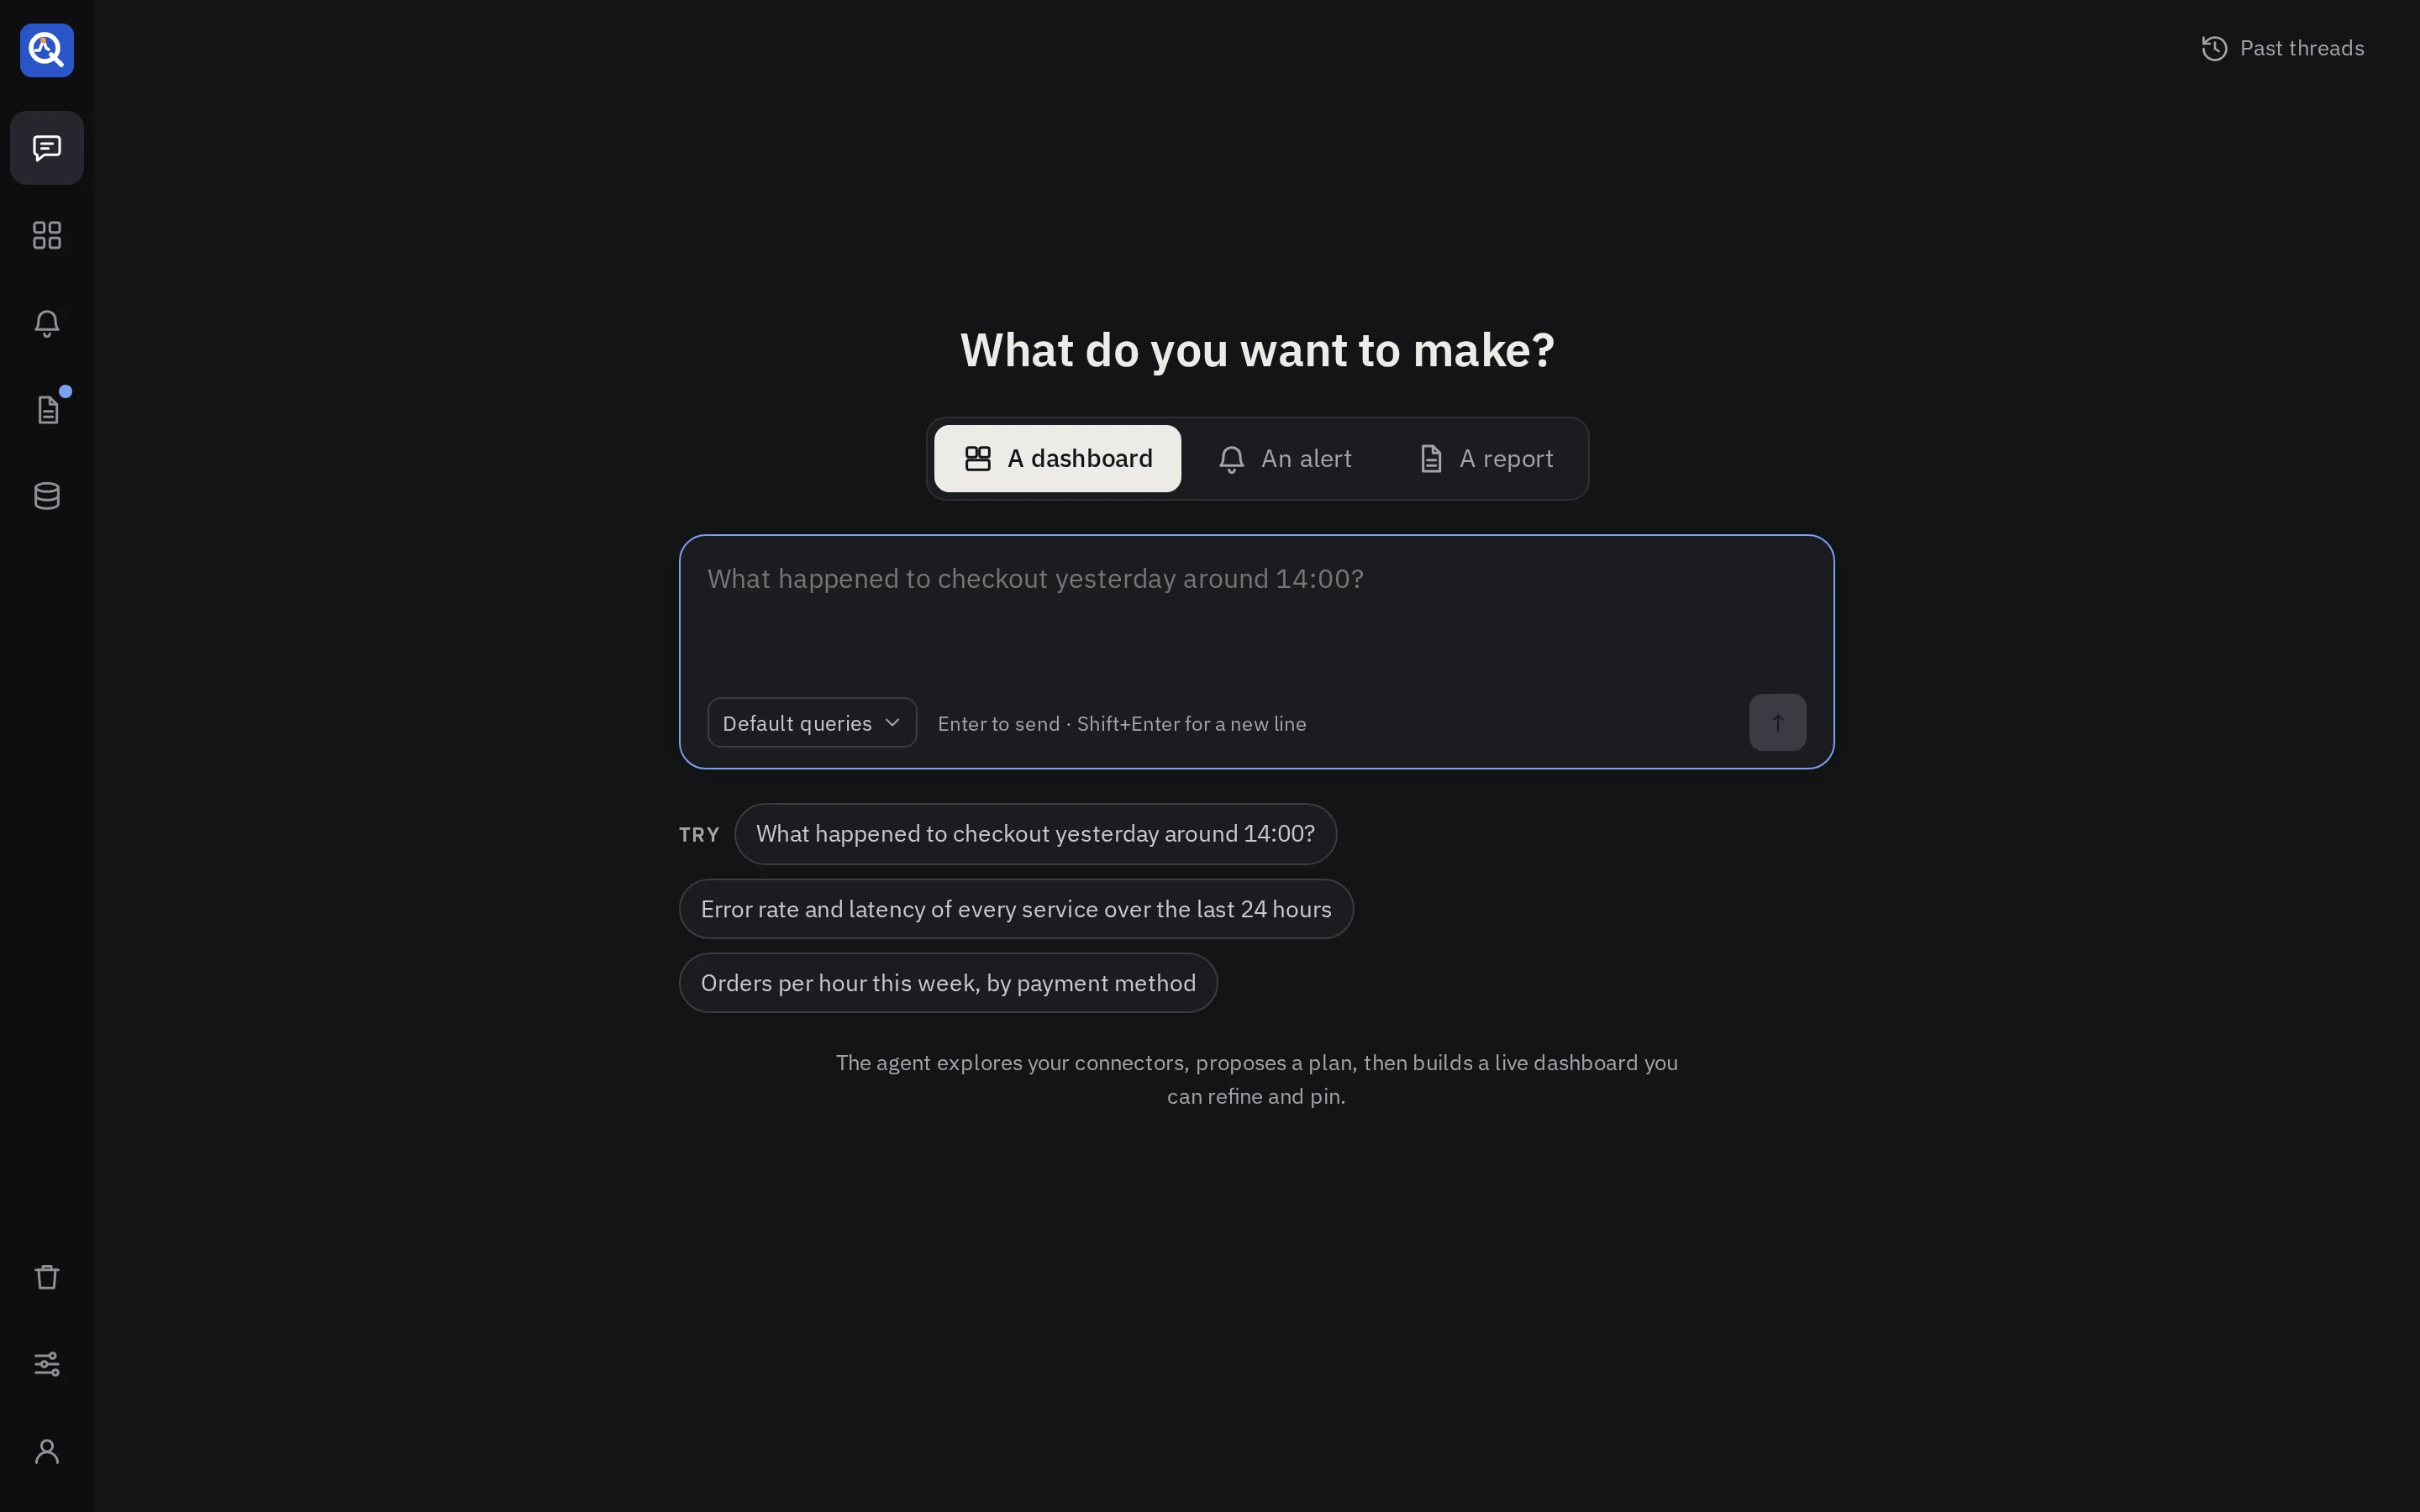
- What do you want to make? Keep A dashboard. The same box starts an alert or a report; a thread makes one kind and keeps it.
- The model. When an admin set up more than one provider, the menu picks the one this thread runs on.
- Queries. Default queries lets the agent use the query builders and saved queries an admin switched on. Choose queries… narrows them for this thread. Free style lets it write raw queries only. Builders give fewer tokens and fewer broken panels; see Queries and charts.
Write as you would to a colleague. Name the time (“yesterday around 14:00”, “the last 30 days”), what to compare and how to split it. Times are read in your browser’s time zone.
Already answered?
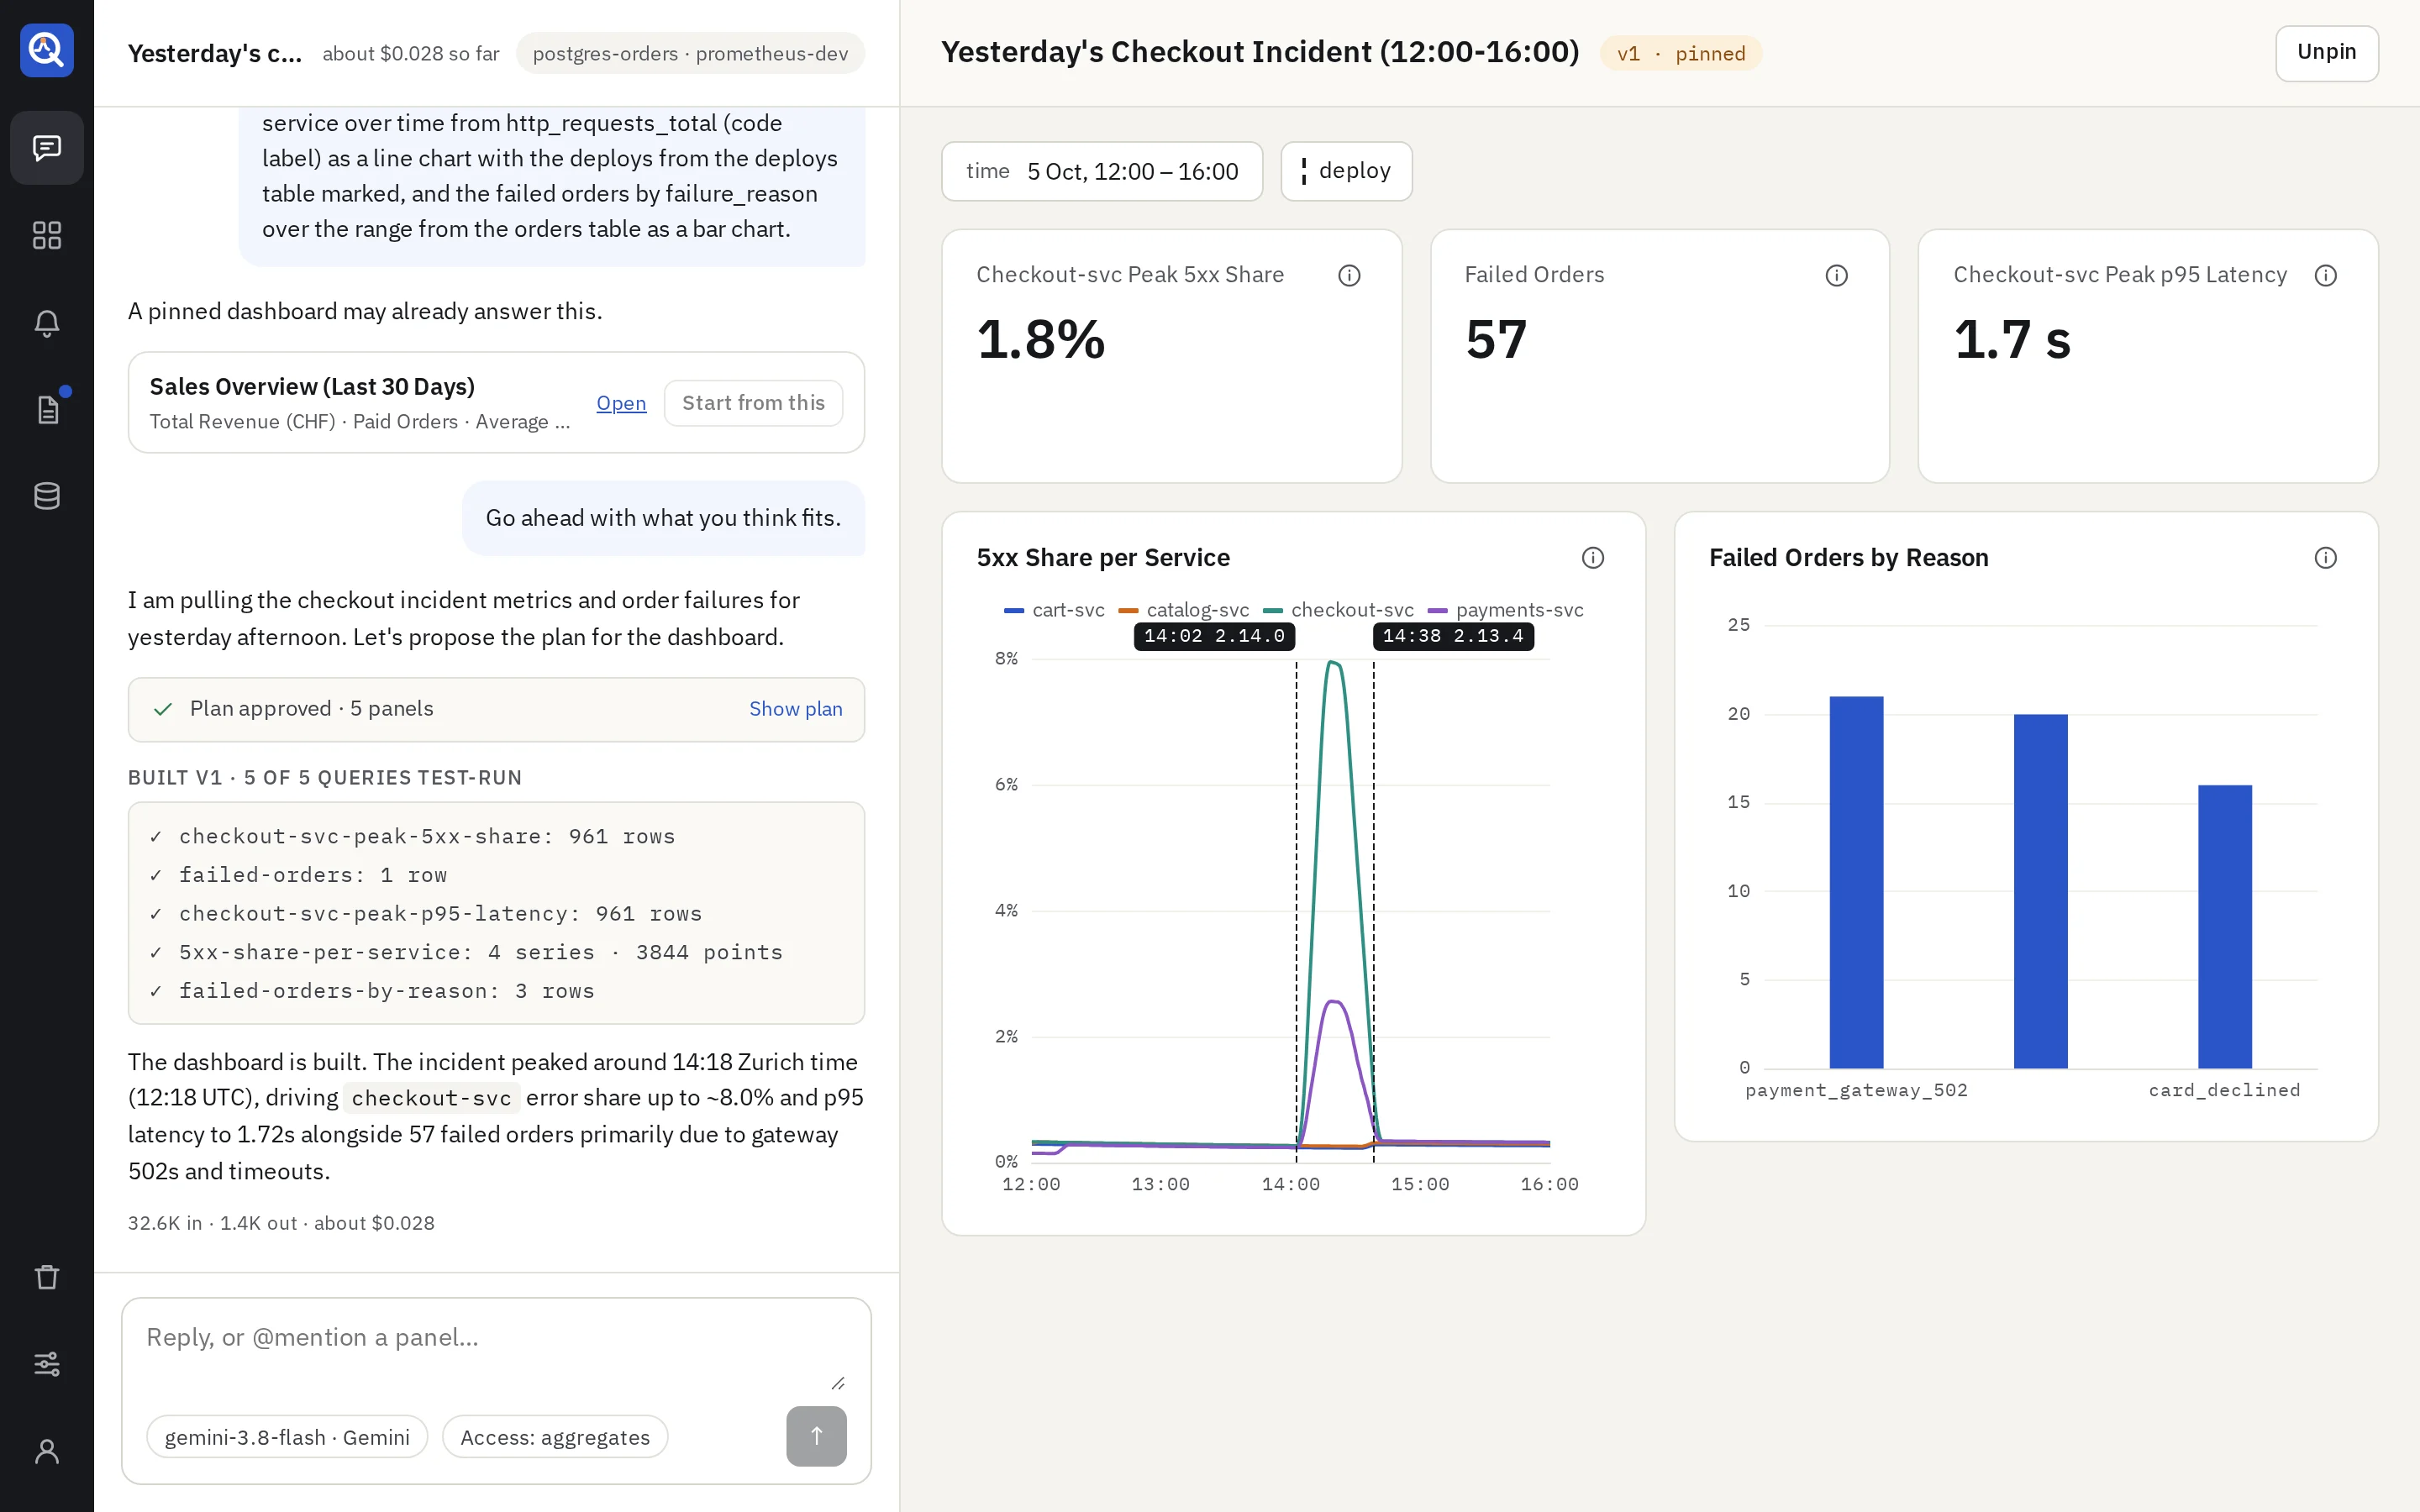
Before it plans, quanthea searches the library for pinned dashboards that may answer the same question, with no model. If one fits, Open it, or Start from this: a copy opens in the thread, ready for changes, and starting from one uses no model. Otherwise, Build a new one.
The plan
The agent reads your sources’ schemas within each source’s access level, then proposes a plan: each panel it will build, what it shows and from which source. Nothing runs against your data until you approve.
- Approve & build starts the build.
- Edit plan, or a reply in the box, changes it. The agent proposes a new one.
- A plan for an existing dashboard lists its changes: CHANGED, NEW, REMOVED, and how many panels stay the same. While the plan waits, the draft previews it: changed panels outlined in orange, removed ones dashed red, new ones as dashed blue placeholders.
An admin can turn on Show the queries in a plan (Settings → Model), so a plan also shows the query each panel will run. Plans then take longer and cost more.
The build
The agent writes each panel as data and a chart. quanthea writes the queries from builders where it can, test-runs every one against your source, and checks the chart fits its data. A panel that fails goes back to the agent with the error.
- A card says when a write did not work: “Not saved · the agent fixes it, try 1 of 3”, with each failing panel and why. A green card says when it was fixed.
- After the repair attempts an admin allows, the build stops and says what still fails. Try again starts over with fresh attempts.
- Each answer shows its tokens and cost under it, and the thread’s total sits in its header.
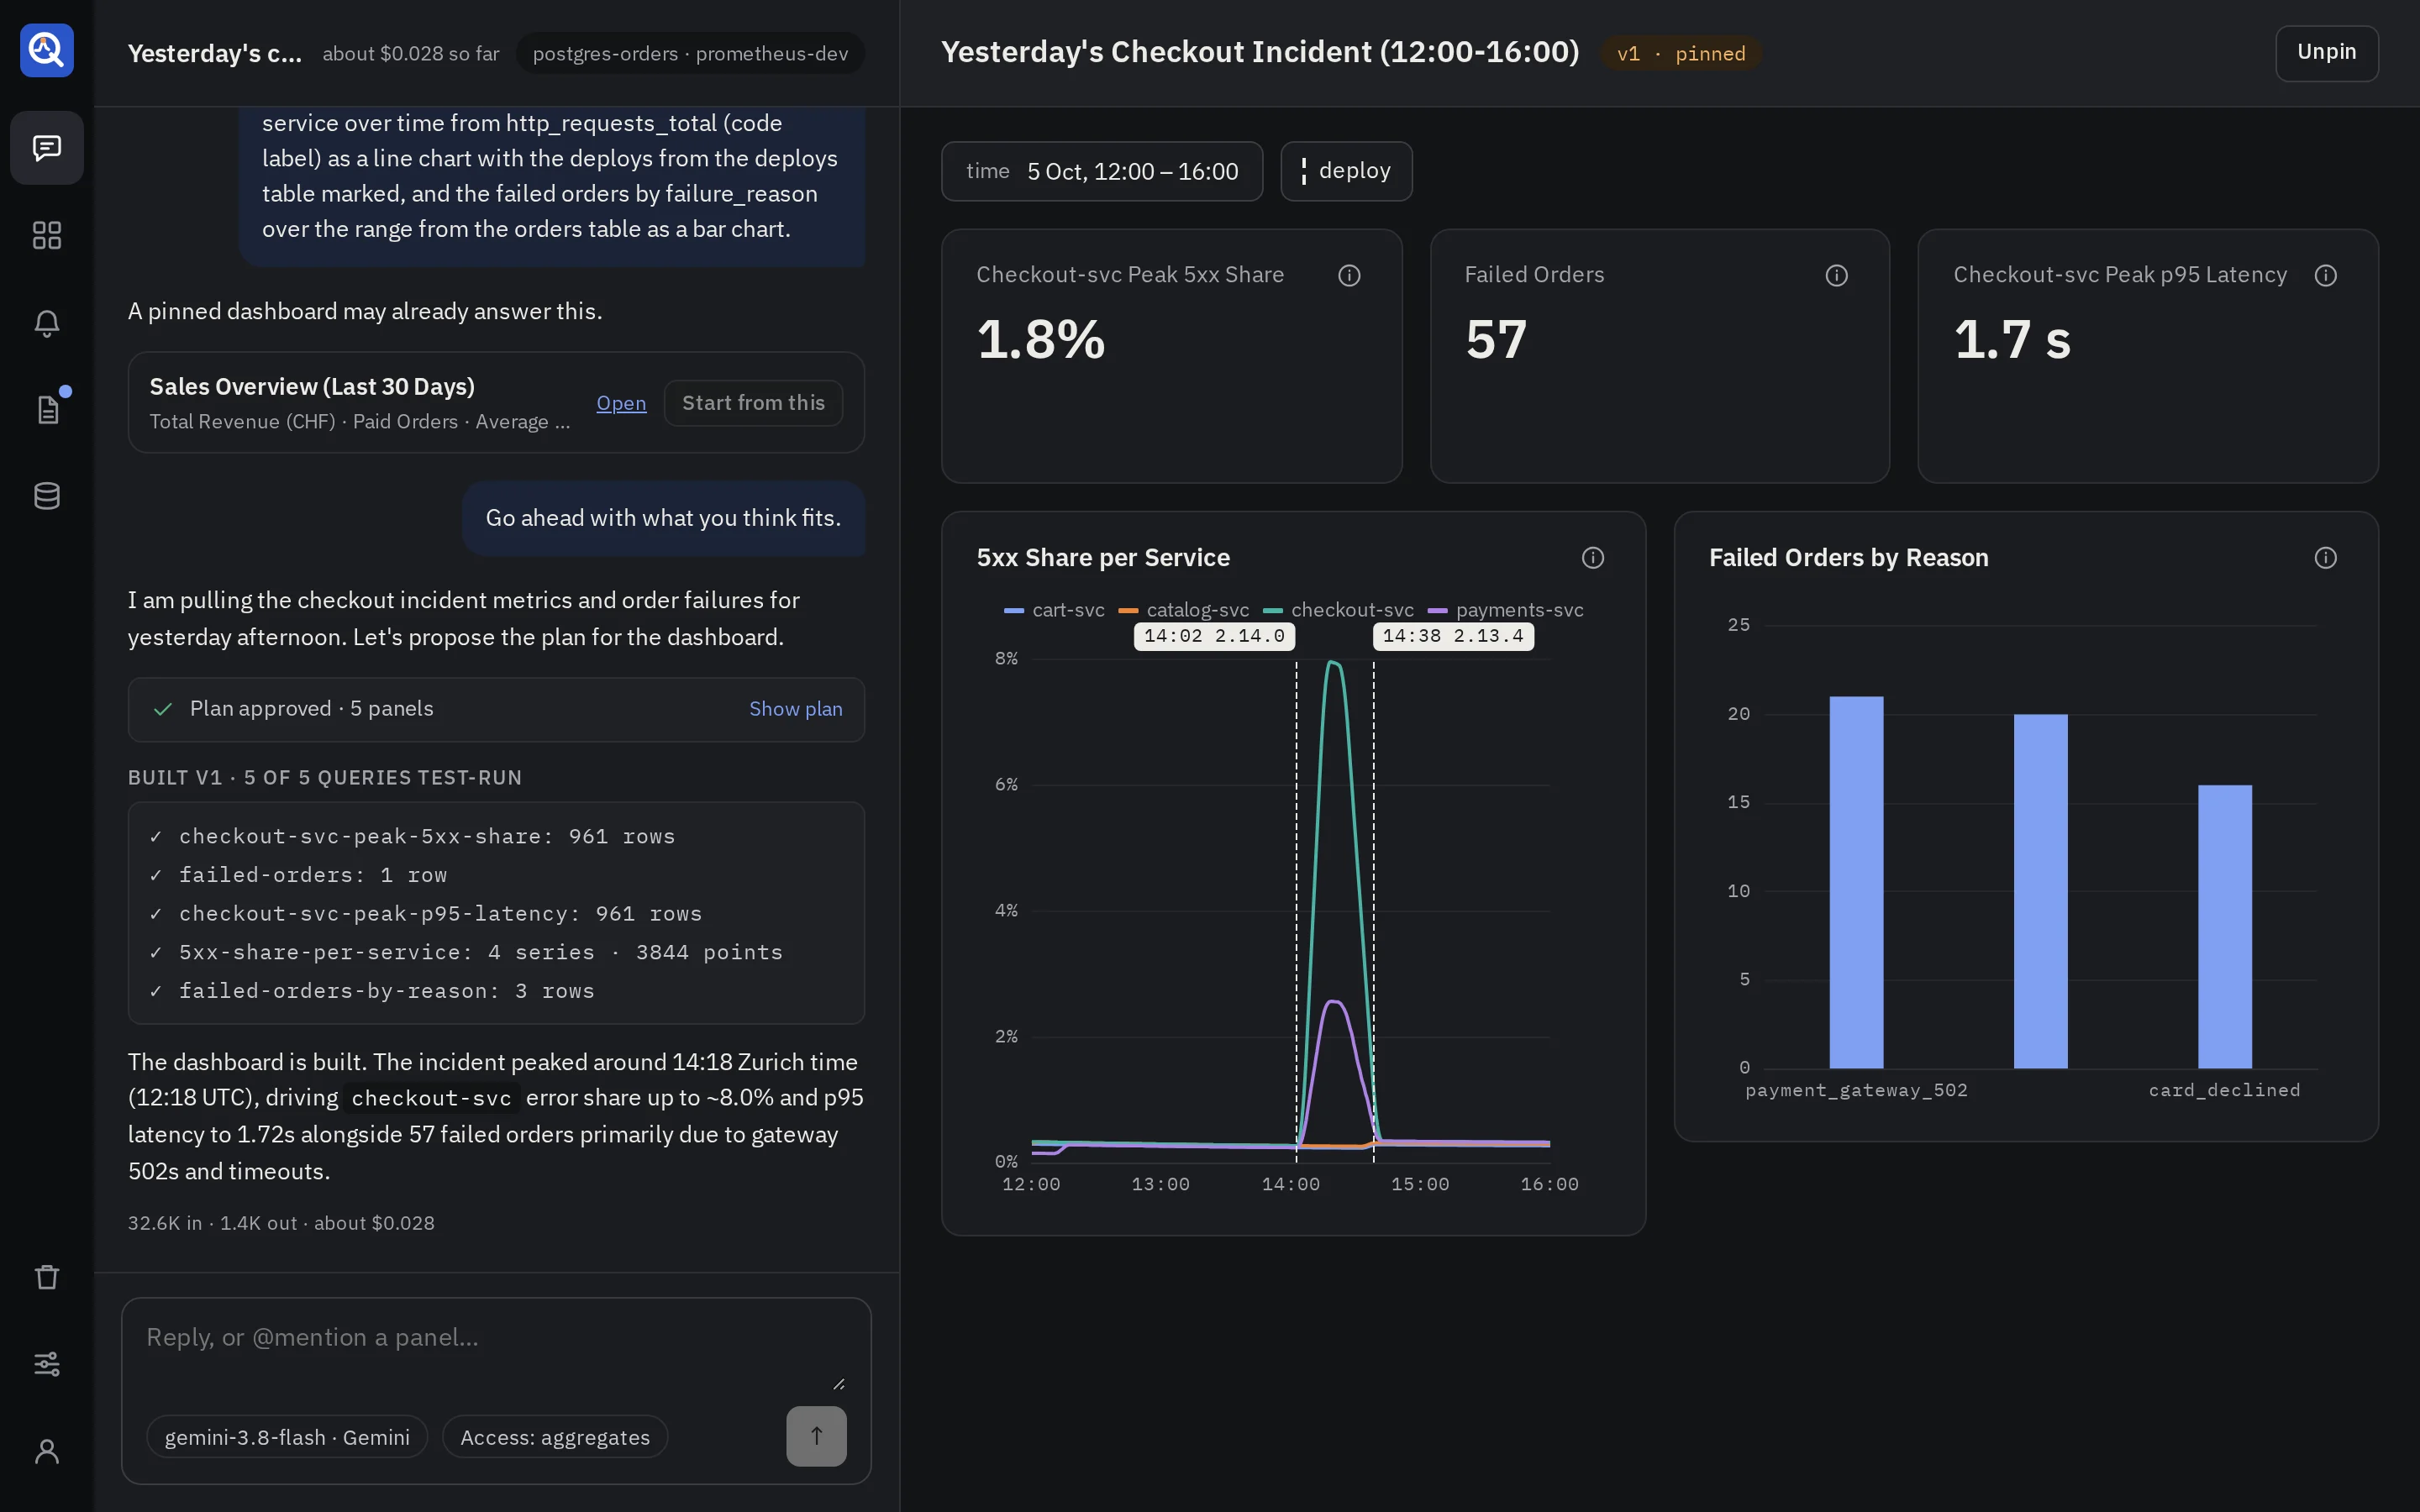
Refine
Keep talking in the same thread: “split the latency by route”, “make the error rate a percentage”,
“add the failed orders by reason”. Corrections skip the plan: changing a panel, removing one, and
adding up to three in one message. A bigger change gets a new plan to approve. Type @ and a
panel’s title to point at one panel. Each change makes a new version, and a card in the conversation
says what changed.
- Undo on a change card goes back to the version before it, as a new version.
- Compare opens the version before the change in the draft pane, to look at it again.
- The draft pane shows the latest version. Its version menu opens an earlier one; the address keeps it, so a reload or a shared link shows the same.
Pin
Pin puts the version you are looking at in the library. Viewers see only pinned versions.
- Pinning test-runs every panel again. A dashboard with a failing query can’t be pinned, and the refusal names each failing query.
- The model writes a one-line description and a few tags for the library. If it is slow or not set up, the dashboard is pinned without them.
- The thread can keep adding versions after that. They stay drafts until you pin one.
- Unpin takes the dashboard out of the library. Viewers no longer open it; editors still do.
Only the thread’s owner and admins pin and unpin a dashboard built in a thread.
Use a dashboard
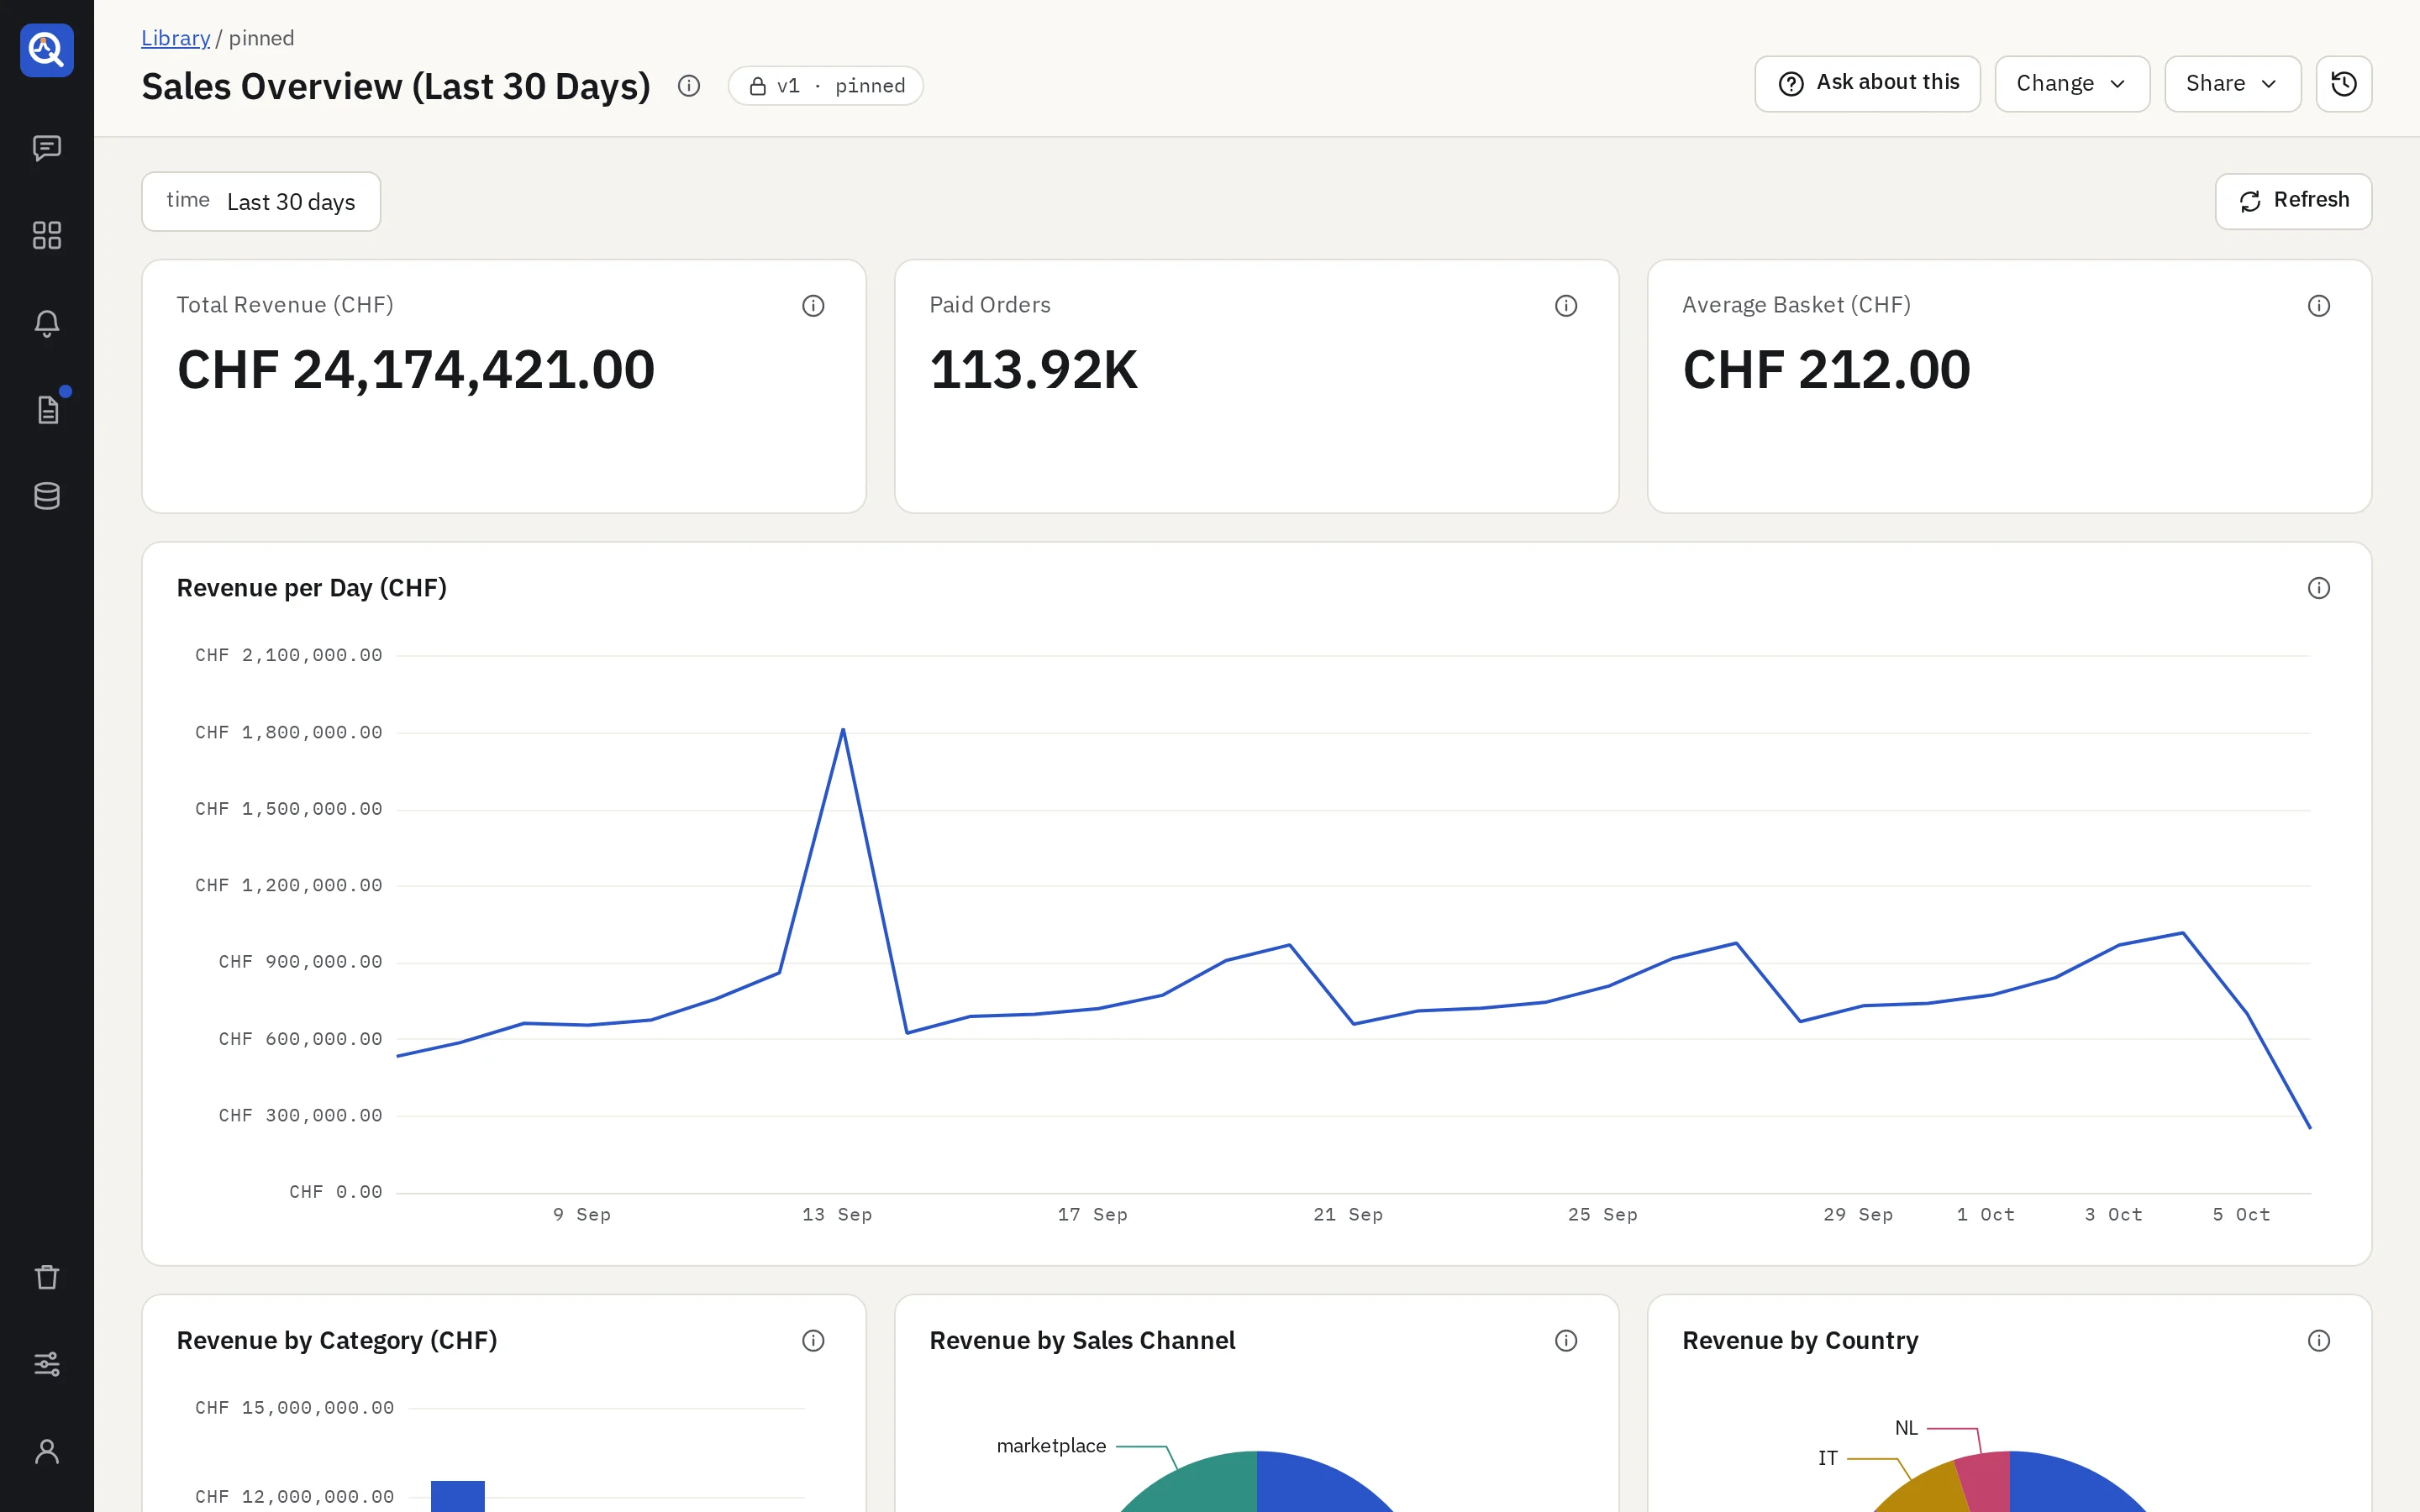
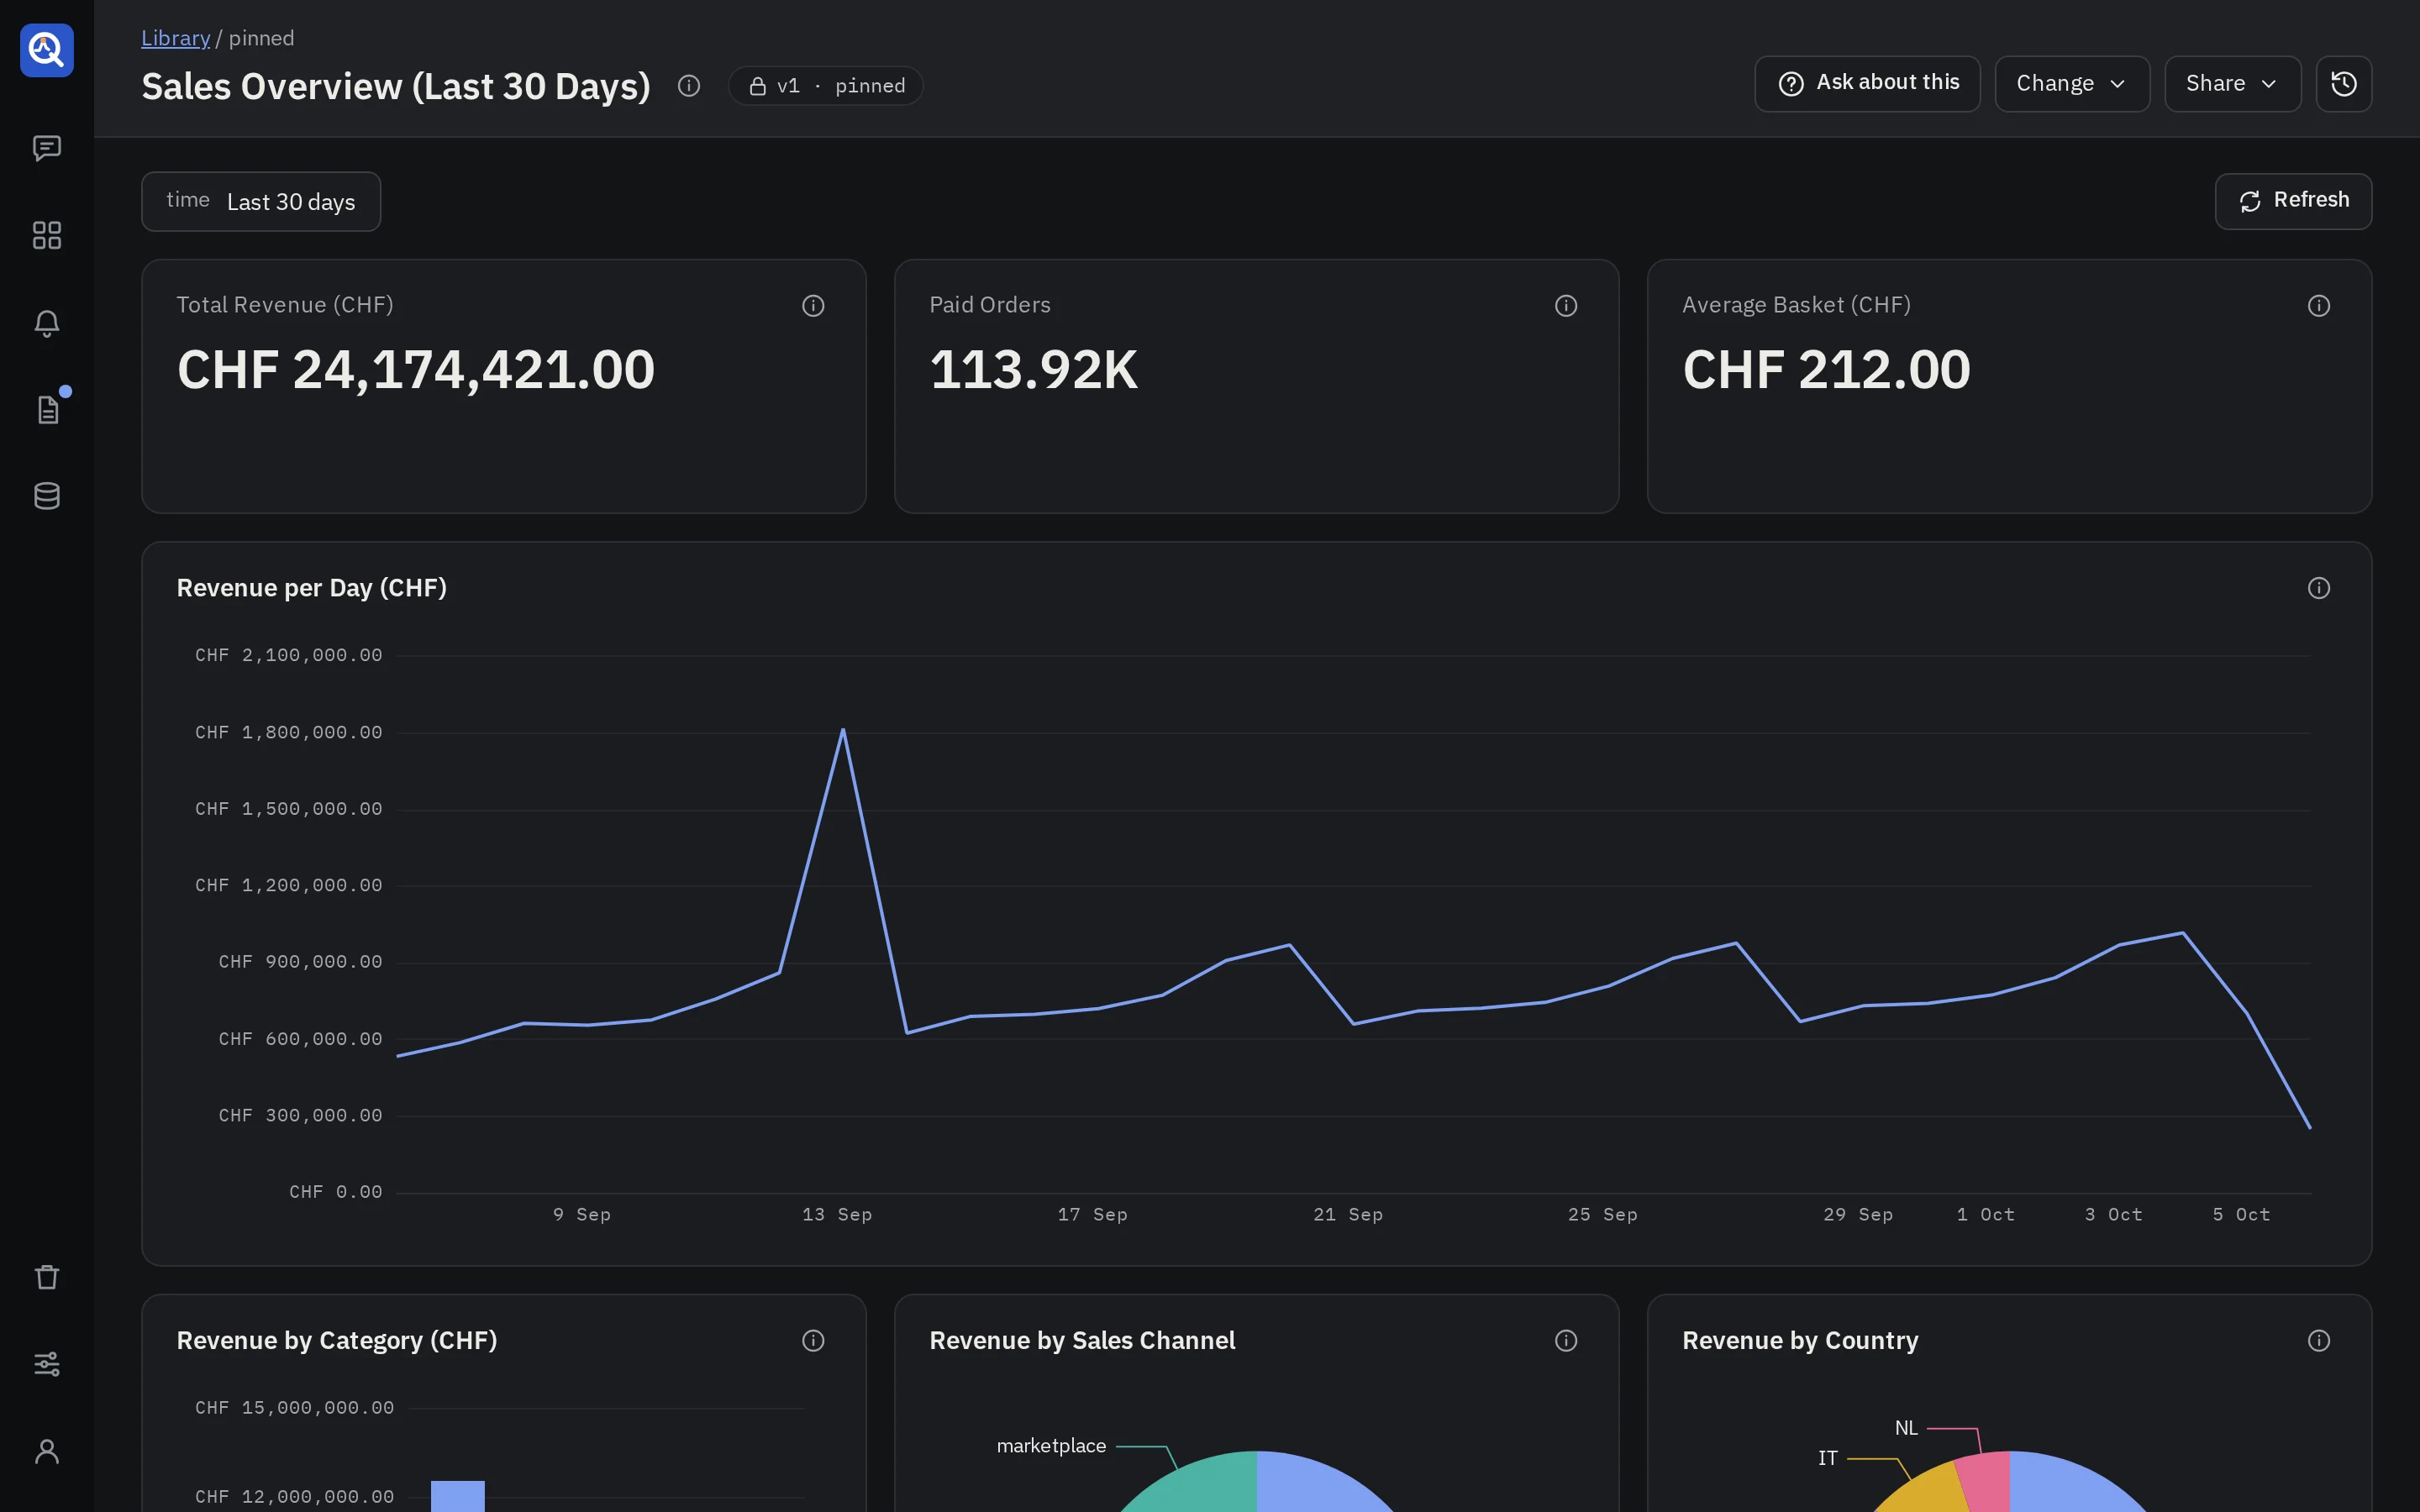
- Time range and variables. The row above the panels holds the time range and the dashboard’s variables, such as an environment or a service. They live in the address, so a link shares exactly what you see. Changing them runs the panels again and never calls a model. A variable can offer “All”, which shows every value at once: ask for “a platform variable with All”, and for All as the default if you want it. A choice can read differently from the value it filters on: “a filter labelled Only SwissTXT that matches true”. A panel title can show the value chosen: “call it Most conflicting $browser versions” reads “Most conflicting Firefox versions” while Firefox is chosen.
- Markers. Events such as deploys or incidents are dashed lines on time charts, labelled
(
14:02 deploy #481). Each set has a toggle at the end of the variables row. - Values in the legend. A chart’s legend can show a number after each line: “with the total of each line in the legend”, or the mean, the last value or the highest.
- One colour per value. Ask for “Web in blue on every chart” or “errors always red”: the dashboard keeps a colour for the value, and every line, bar or scatter series named after it takes it, in the light and the dark scheme, and so do its slice of a donut, its bar in a ranked bar chart and its cells in a table. Other series keep their usual colours.
- Refresh runs every panel again. Its tip says how many saved queries ran, against which sources, how long they took, and that no model was called.
- Where a number comes from. Each panel’s info bubble shows its source, the query it runs and the chart that draws it. On a pinned version it also holds the panel’s explanation.
- Alerts on panels. A panel an alert watches shows a state pill, and its time chart draws the alert’s threshold and when it fired.
- Long series. A chart over time asks its source for no more points than it can show: 200 for
each of the 12 columns of the grid it spans. Over a longer time range the points are further
apart, as a Prometheus query that follows
$__intervalwidens its step and a query that buckets by the interval widens its buckets. Nothing is cut off the end. A query with a width of its own keeps it: a line of more than 500 points is drawn through the lowest and the highest point of each pixel, so its spikes and dips show, and a tooltip still reads a point of the data. A line with missing values, or with a gap in its times, is drawn point by point. - The whole time range. A chart over time shows all of the time range you picked, from its
start to its end, whatever the source returned. A week of which one day has data is drawn as a
week, with the rest empty. A stretch with no data is a gap in a line and no bar. A count reads 0
where the source can say so. An average or a ratio over nothing has no value, and is never
drawn as 0. A point with nothing on either side is drawn as a dot.
- On Elasticsearch and OpenSearch a count over time that is not split into series has a point for every interval of the range, 0 where there is no document. This holds up to 1500 intervals over the range; a finer count shows only the intervals that have documents.
- A count split into series, such as by level, has no point where a series has no document, so its line shows a gap there, not 0.
- SQL and MongoDB return only the rows that exist, so the chart leaves their empty stretches blank.
- A gap is seen from the data: a stretch wider than the usual distance between two points. A chart of two points, or one whose points are mostly further apart than its closest two, has no usual distance, and its line joins them across the empty stretch.
- A panel whose query names its own dates, and not the time range, shows the stretch its data covers.
- To see a chart cut to the stretch that has data, ask for it in the thread: “cut this chart to its data”.
- A snapshot and a report’s run show the time range they ran over.
- Tables. Click a header to sort by that column, again to reverse it, a third time to go back to the table’s own order. A table longer than a page has a filter under each header and Previous and Next below it. A page shows 20 rows; ask for another number in the thread: “show 50 rows a page”. Sorting, filters and the page are yours alone and change nothing in the dashboard. Columns can be narrow, medium or wide: “make the URL column wide”. A long value is cut, and shows whole when you hover it.
- Coloured cells. A table column can show a value as a text, in a colour, or both:
0as “idle”, a load time green under 2 seconds, amber up to 4 and red above. Ask for it in the thread: “colour the median by steps: green under 2 s, amber from 2 to 4, red above”, or “show null as none”. The colours are named tones (neutral, good, warning, bad and eight series colours) that follow the light and the dark scheme. Say “as a background” for a tint behind the text. - Coloured numbers. A single number takes the same steps and texts: “the 90th percentile as a number, green under 2 seconds, amber from 2 to 4, red above”, or “show 0 when there is no data”. A report that uses the panel as a headline keeps the number.
- Coloured gauges. A gauge takes steps too: “disk used as a gauge up to 100 %, green under 70 %, amber from 70 to 90, red above”. The steps tint the dial, and the bar takes the colour of the step its value is in. A gauge with a needle shows the steps in their colours.
- A result cut short. When a source returns more rows than the connector’s row limit, the chart says so under it. Narrow the time range to see the rest.
- Charts further down draw when you scroll to them, and all of them draw when you print the page.
- About (the info icon by the title) gives the description, the tags and the sources.
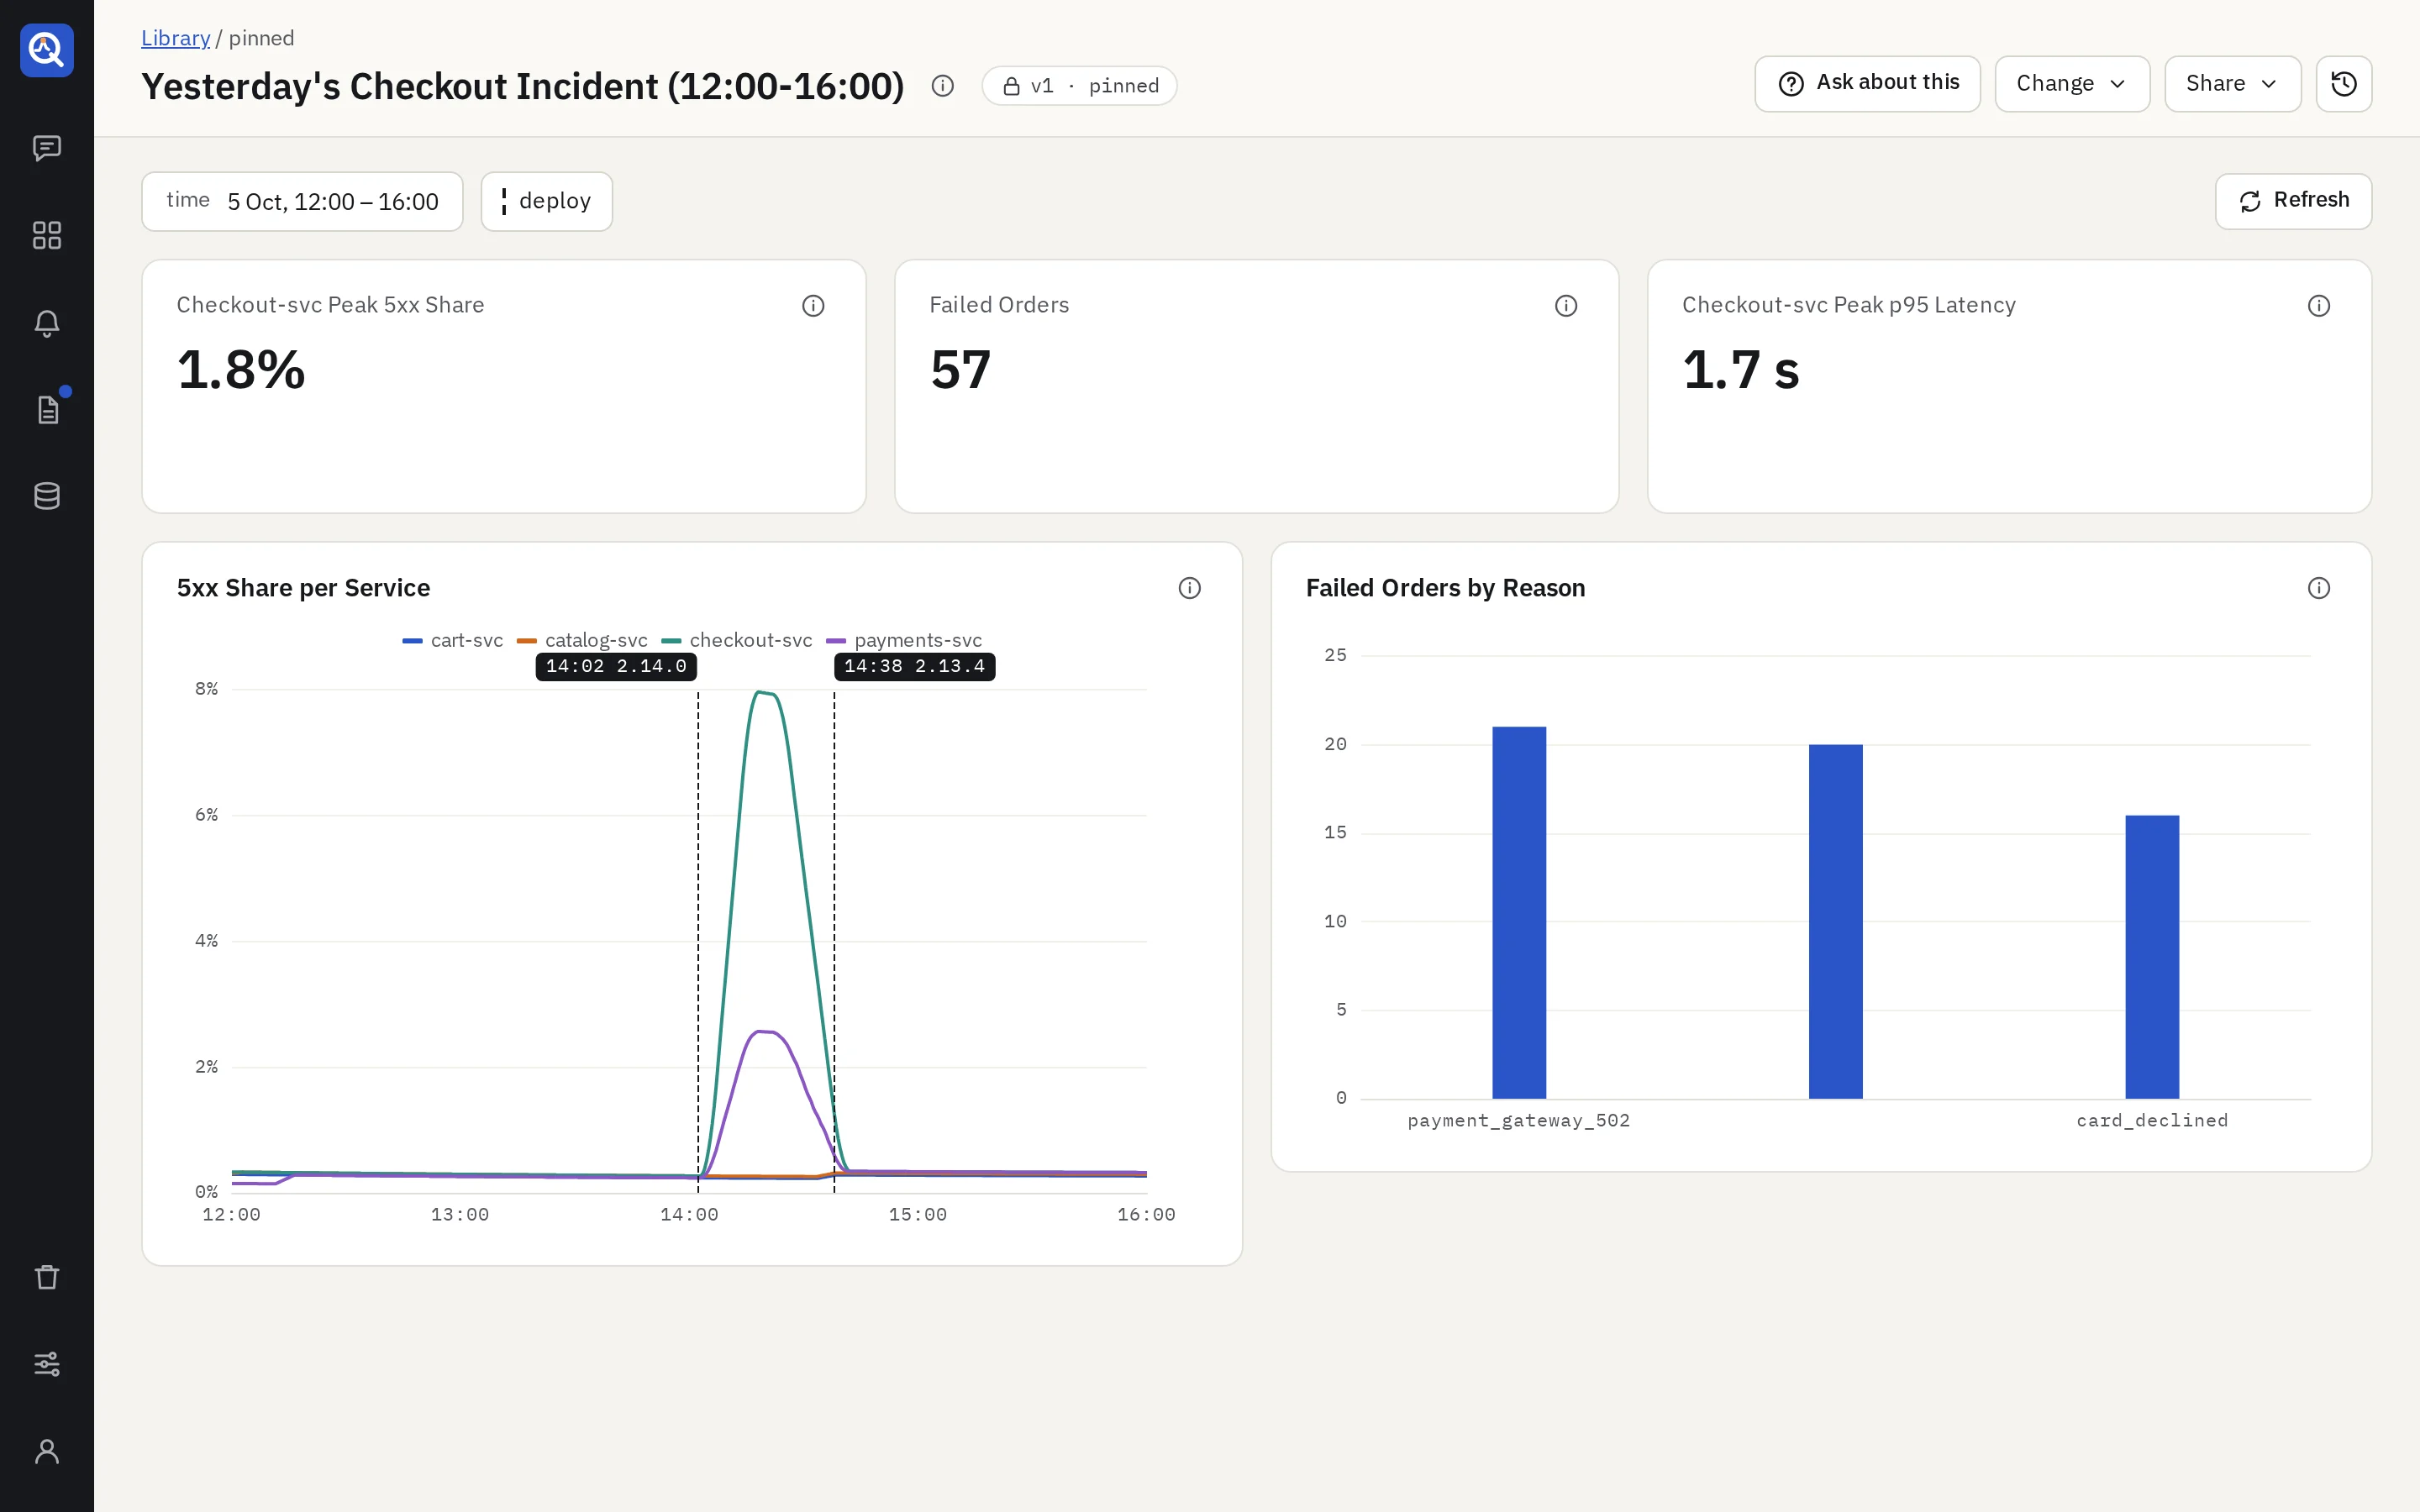
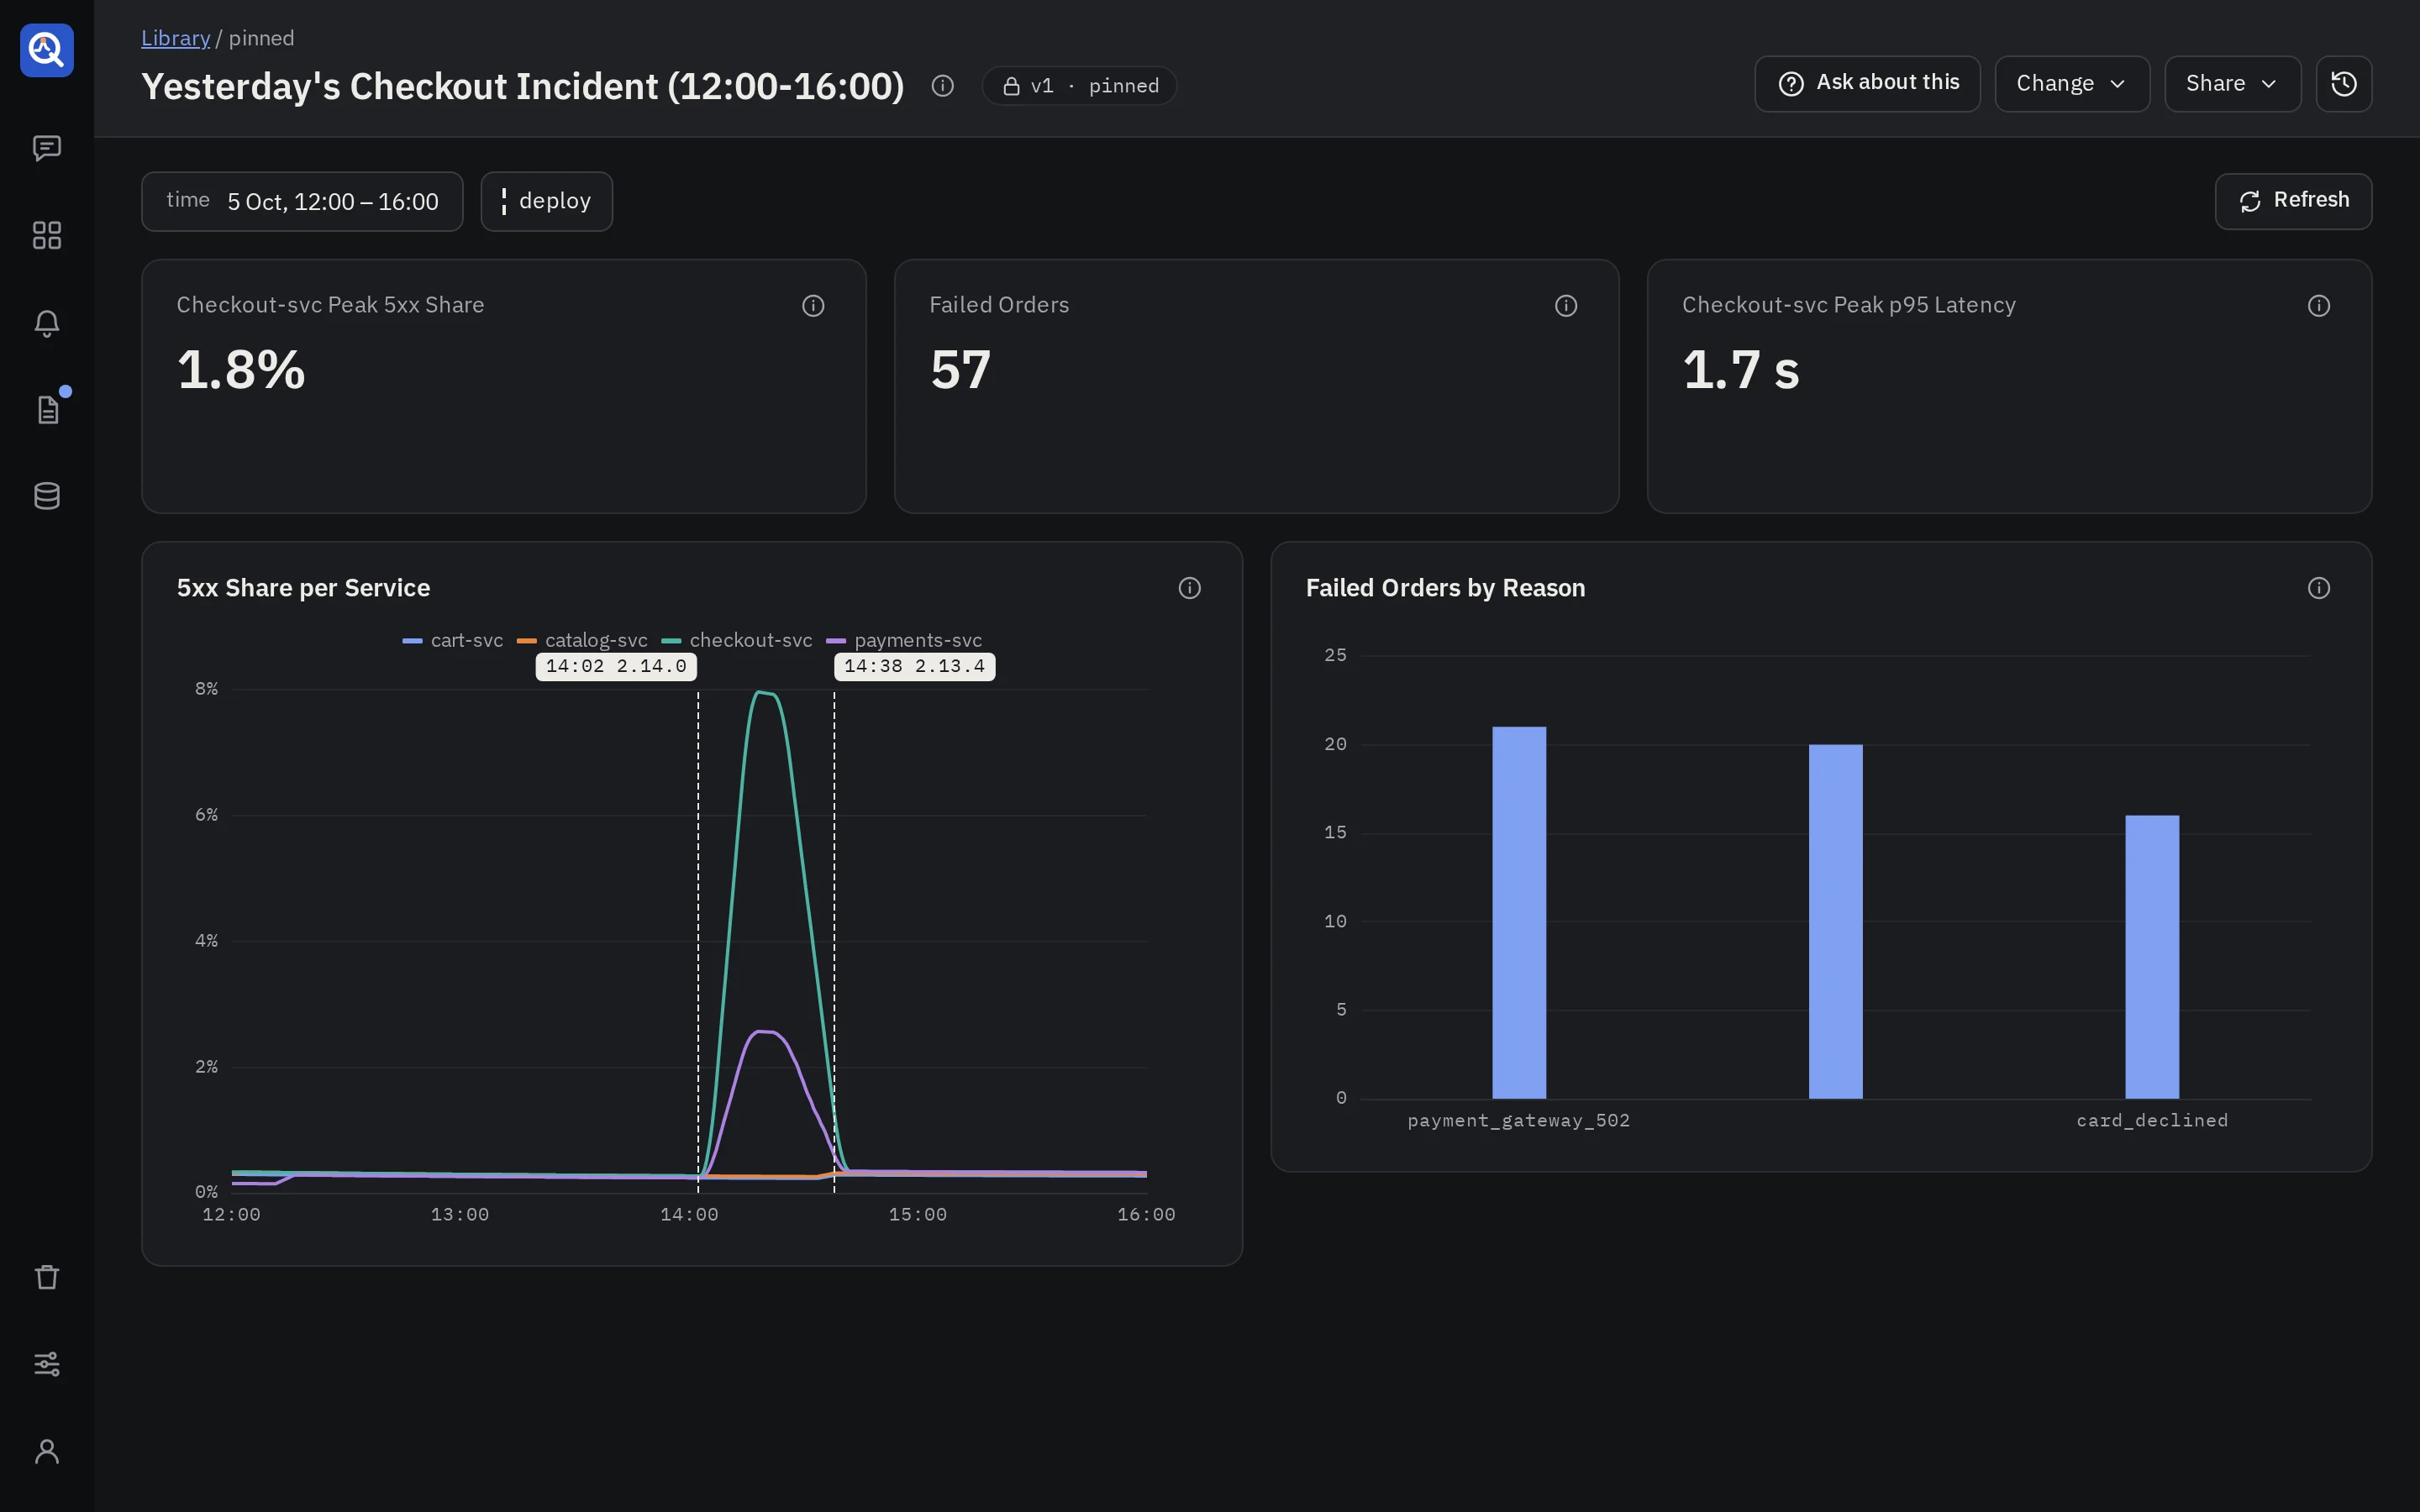
The header’s actions
- Ask about this opens the side panel to ask questions about what the dashboard shows.
- Change (editors):
- Edit with the agent opens the thread that built the dashboard, or starts one when it has none.
- New dashboard from this copies the version you see into a new thread, ready for changes. The original stays as it is.
- Share: Copy link, and for editors, snapshots.
- Versions lists every version, newest first: when it was made, whether it is pinned, and what changed. Editors pin any of them from there, an earlier one included, which rolls the library back. Versions are never rewritten.
Arrange a pinned dashboard
The thread’s owner and admins can arrange the version the library shows, on a screen wide enough for its twelve columns. Arranging changes how the version is shown, never the version: no new version is made, and the thread’s drafts stay as they are.
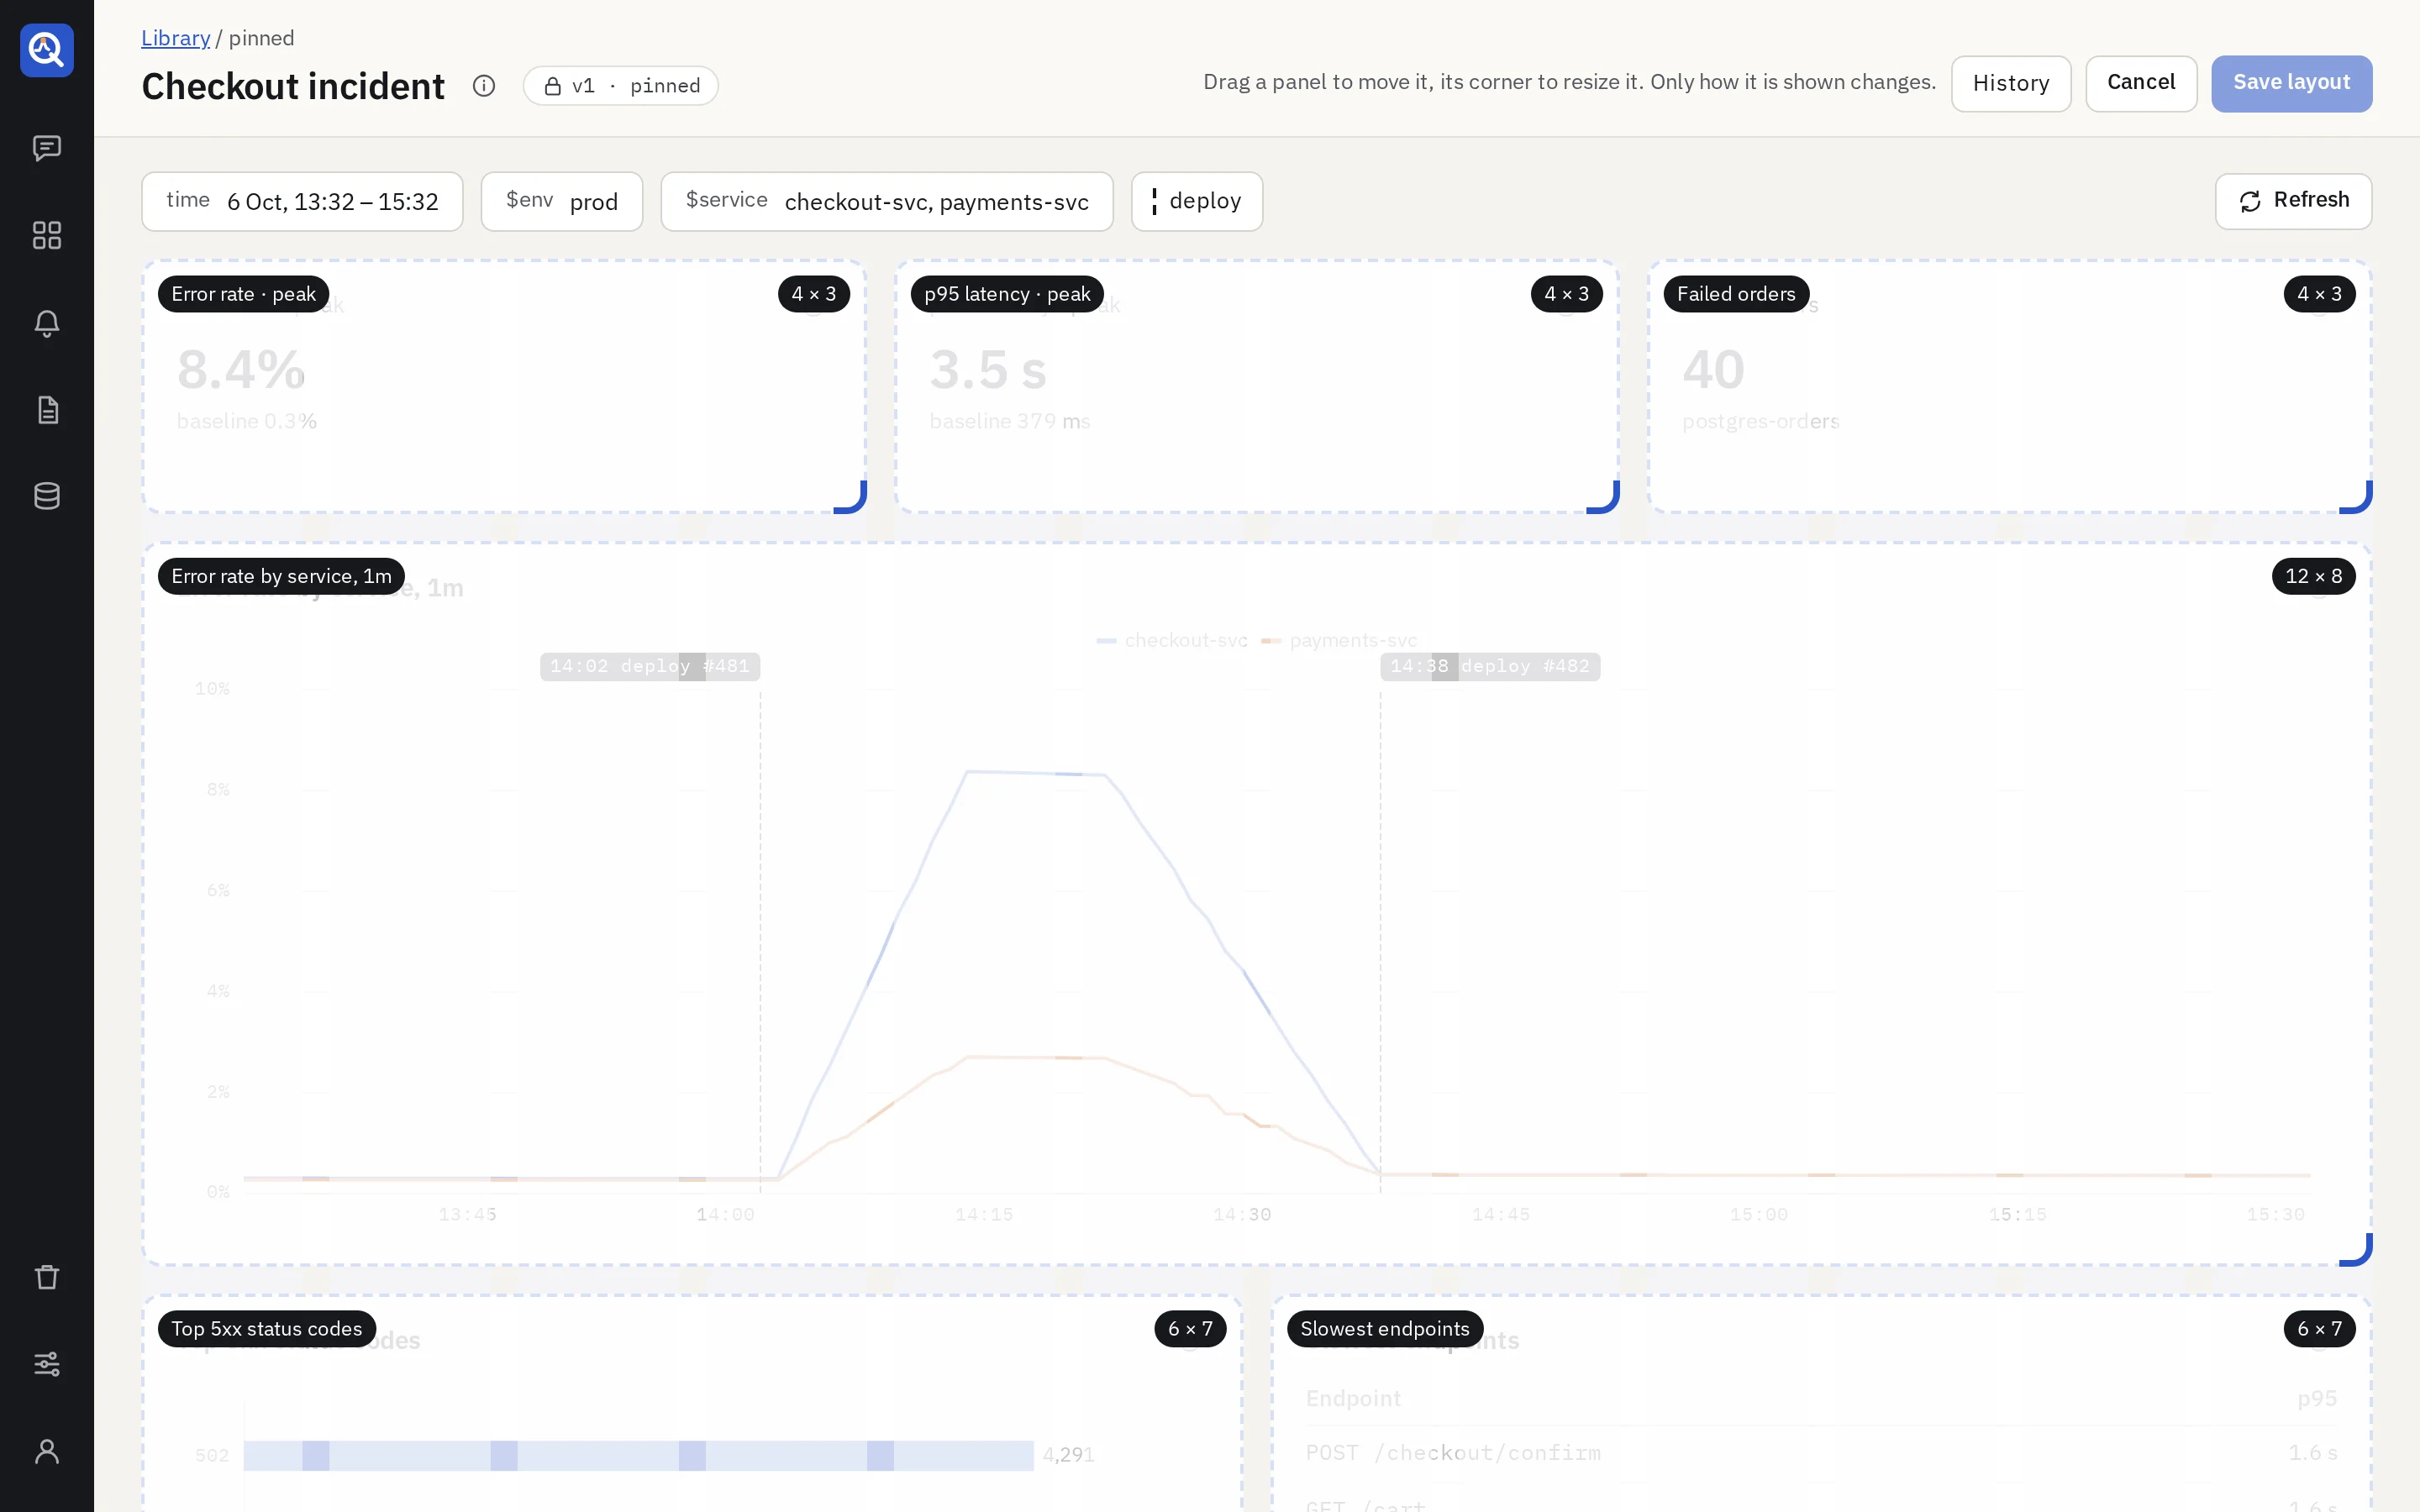
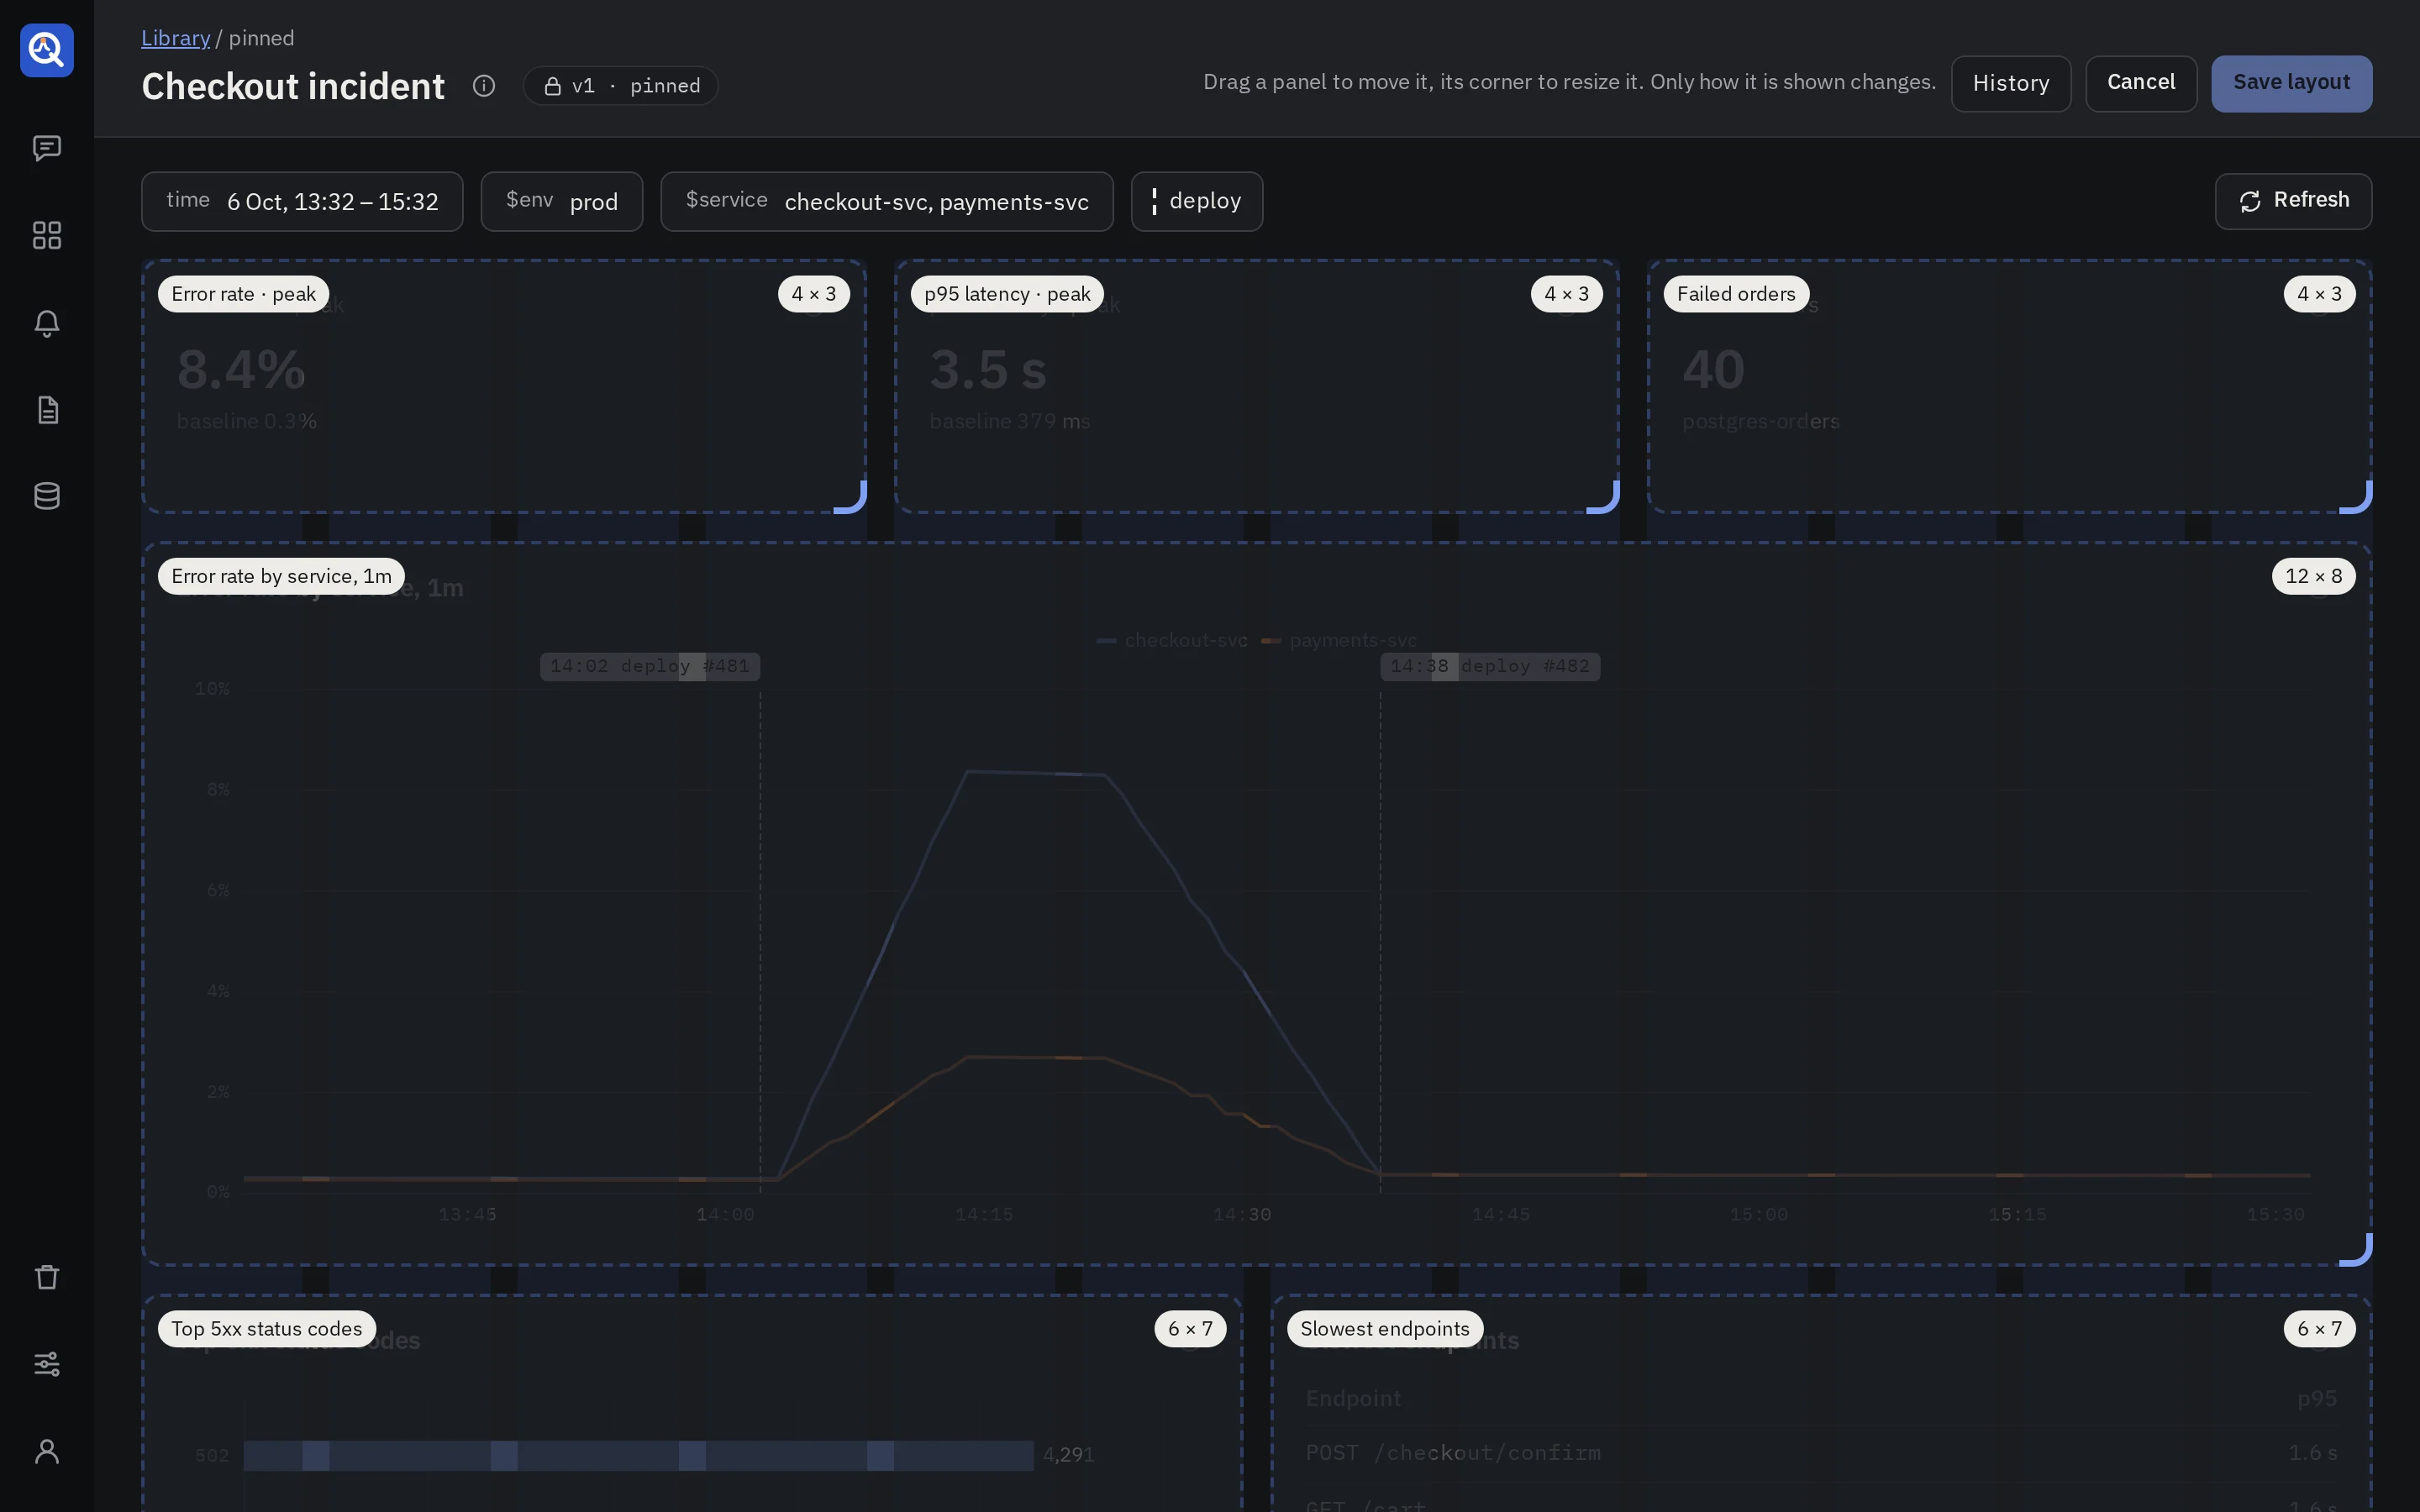
- Edit layout, in the header, lays a frame over each panel. The panels stay live under them.
- Move a panel by dragging its frame, and resize it by dragging the frame’s corner. It snaps to the grid; the other panels move out of the way and rise into the gaps.
- Full width, Half width and Hide sit at the foot of each frame. A hidden panel stays in the dashboard but is not shown, takes no space and is left out of snapshots and questions. Hidden in the bar lists them, and Show puts one back where it was.
- With the keyboard, Tab to a frame. The arrow keys move it, Shift and an arrow resize it, and H hides it.
- Save layout shows the arrangement to everyone. Cancel drops it. Leaving the page with an arrangement unsaved asks first.
- History lists the saved arrangements. Restore brings an earlier one back as the latest.
Each version keeps its own arrangement. Pinning another version shows that version’s own, and a version pinned for the first time shows the grid the agent wrote.
The agent sees the arrangement when you go back to the thread. It builds the next version from
it, and asks whether to remove the panels you hid. The draft pane marks them hidden on v3.
In a thread, ask the agent for an arrangement in words: “put the numbers in one row”, “the chart beside the table”, “make the latency chart full width”, “these three across”. It places the panels in rows that fill the grid, and it reads the result back, so it sees a row with empty columns or a table too narrow for its columns and repairs it. It leaves an arrangement you made by hand as it is unless you ask.
Past threads
Past threads, at the top right of the new thread screen, lists your threads by day, with a search and a filter: All, Live (a pinned dashboard, or an active alert or report) and Drafts.
- Each thread has a button to move it to the bin. A thread whose dashboard is pinned can’t go there: unpin it first.
- With Drafts on, Delete all my drafts moves every draft of yours to the bin at once. Other people’s threads are never touched.
A thread belongs to whoever started it. Admins read anyone’s thread but never write in it.