


Alerts
An alert watches one query and tells a channel when a condition holds: “tell me when checkout’s 5xx share stays above 2% for 5 minutes”. The agent writes it in a conversation, and the server checks it on a schedule with no model.
Editors write and activate alerts. Analysts also mute them. Every role reads them.
Write one
Open Threads, pick An alert, and say what to watch, when it should fire and who hears:
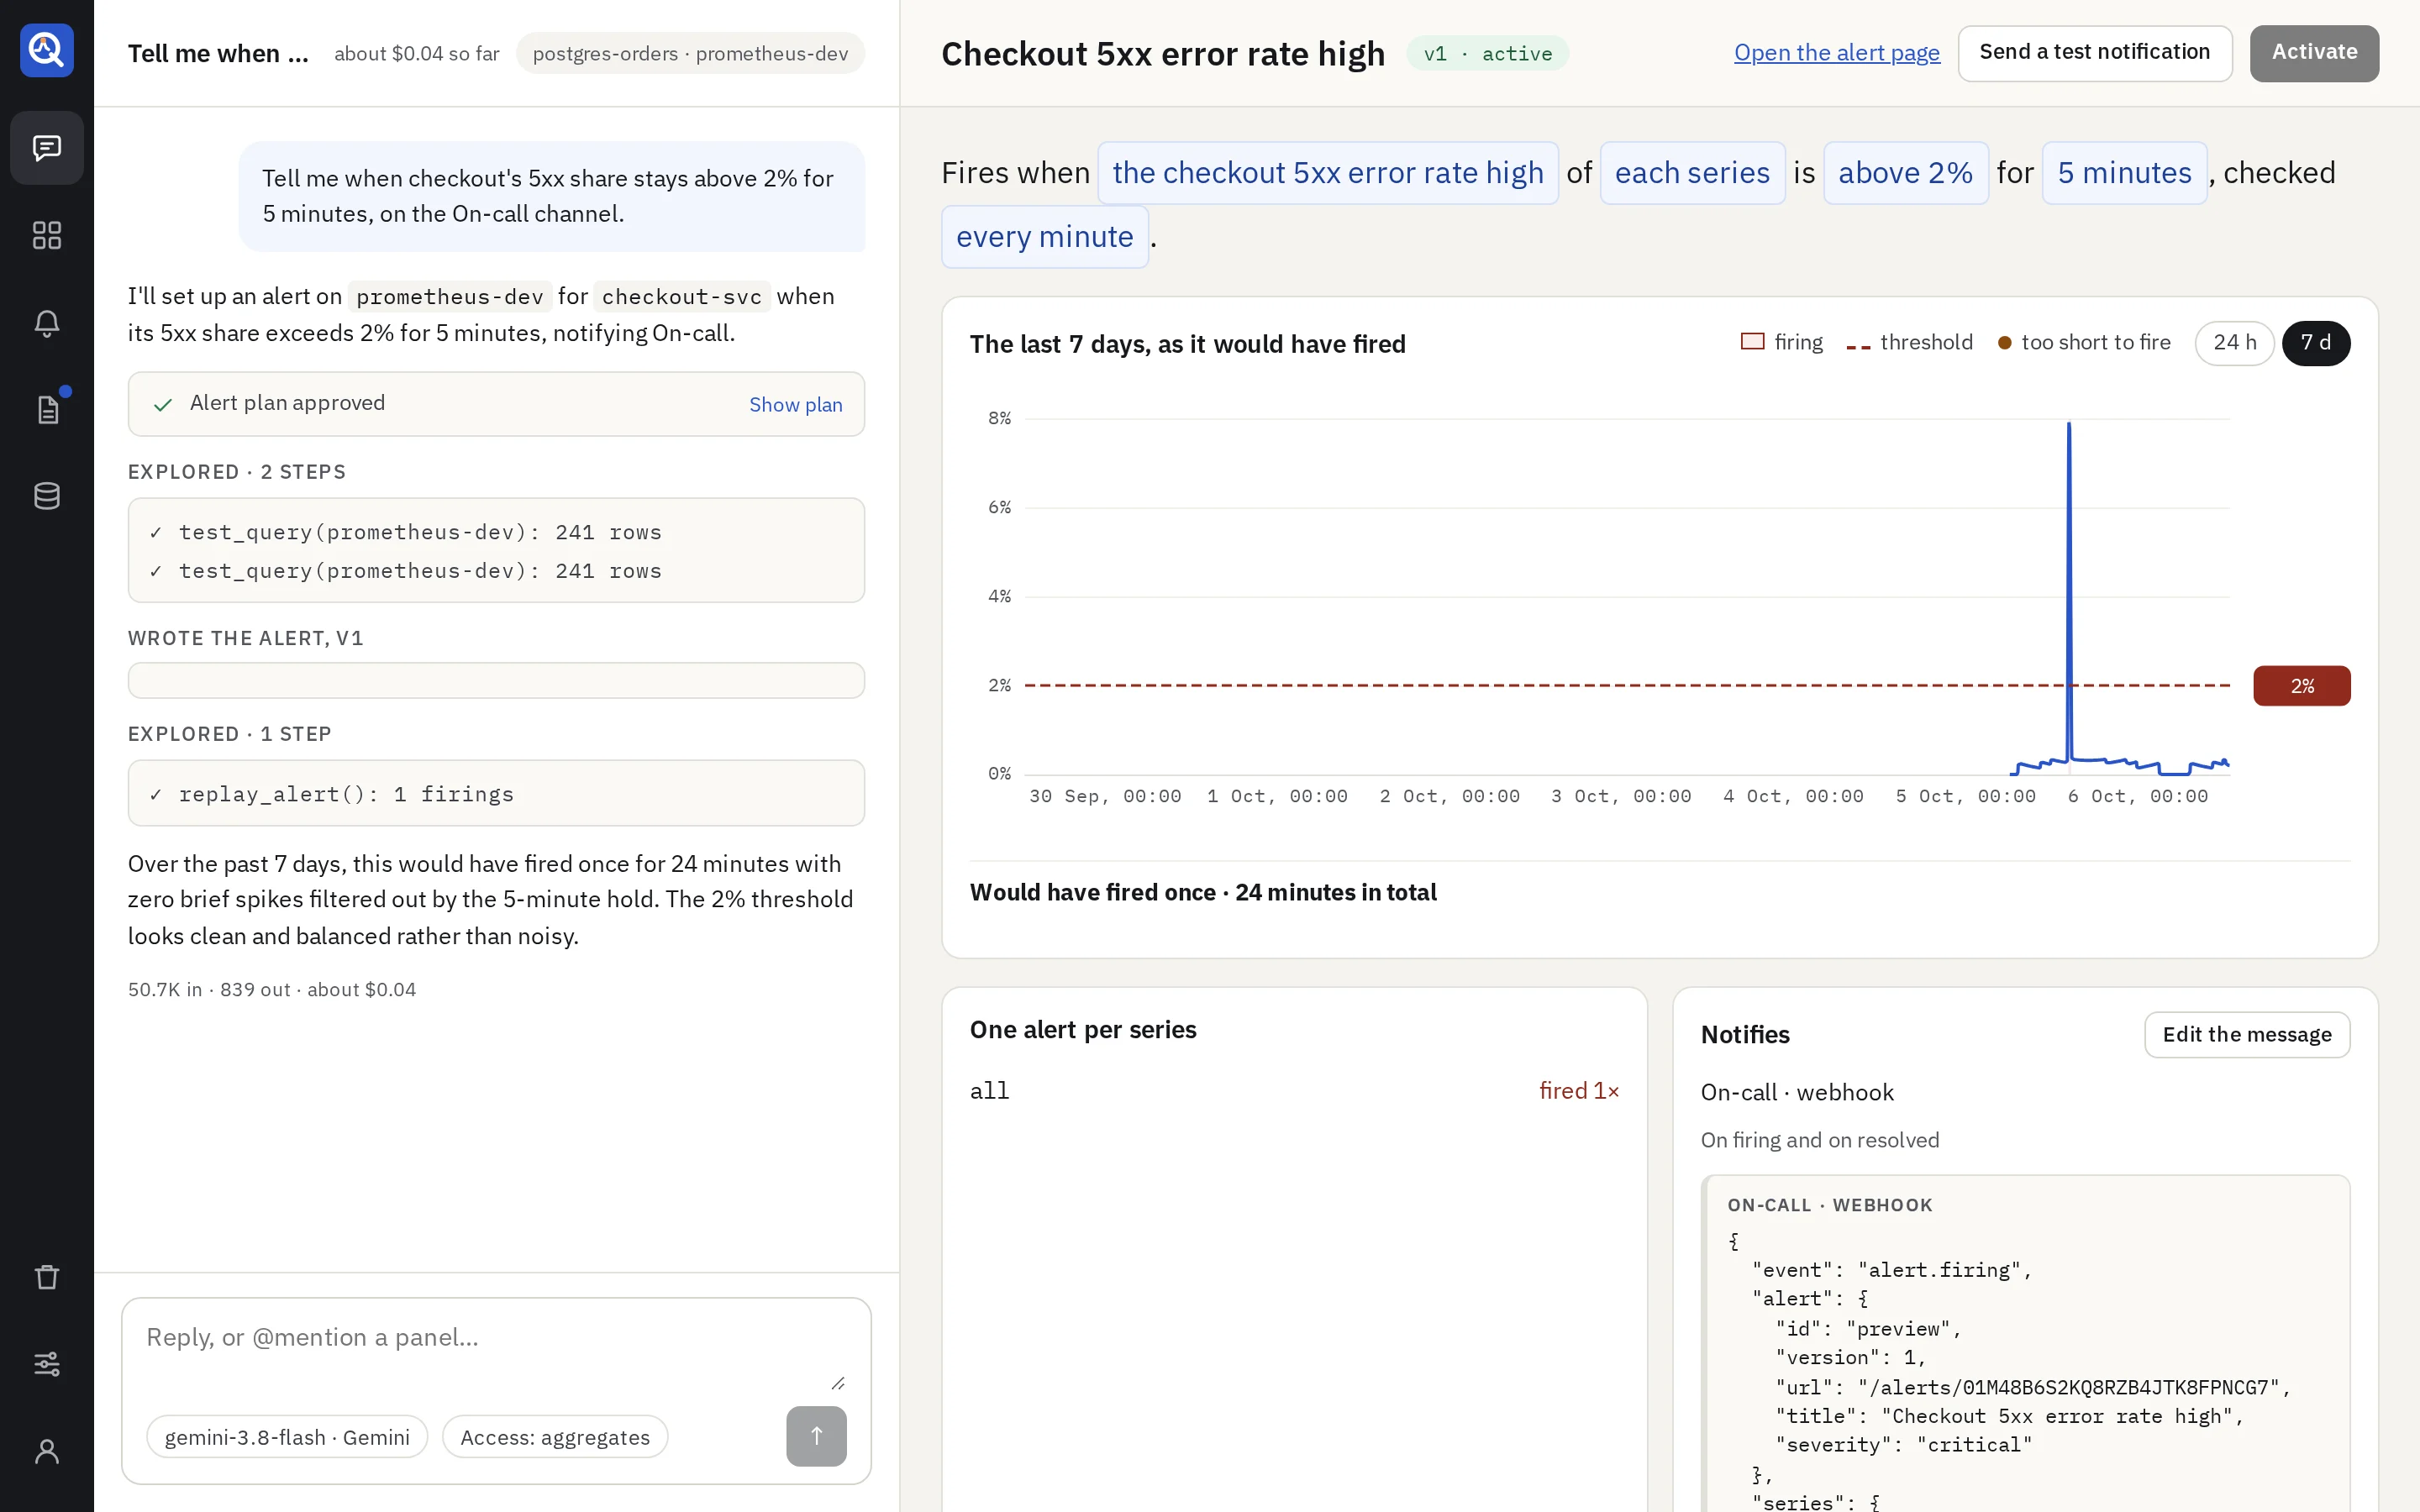
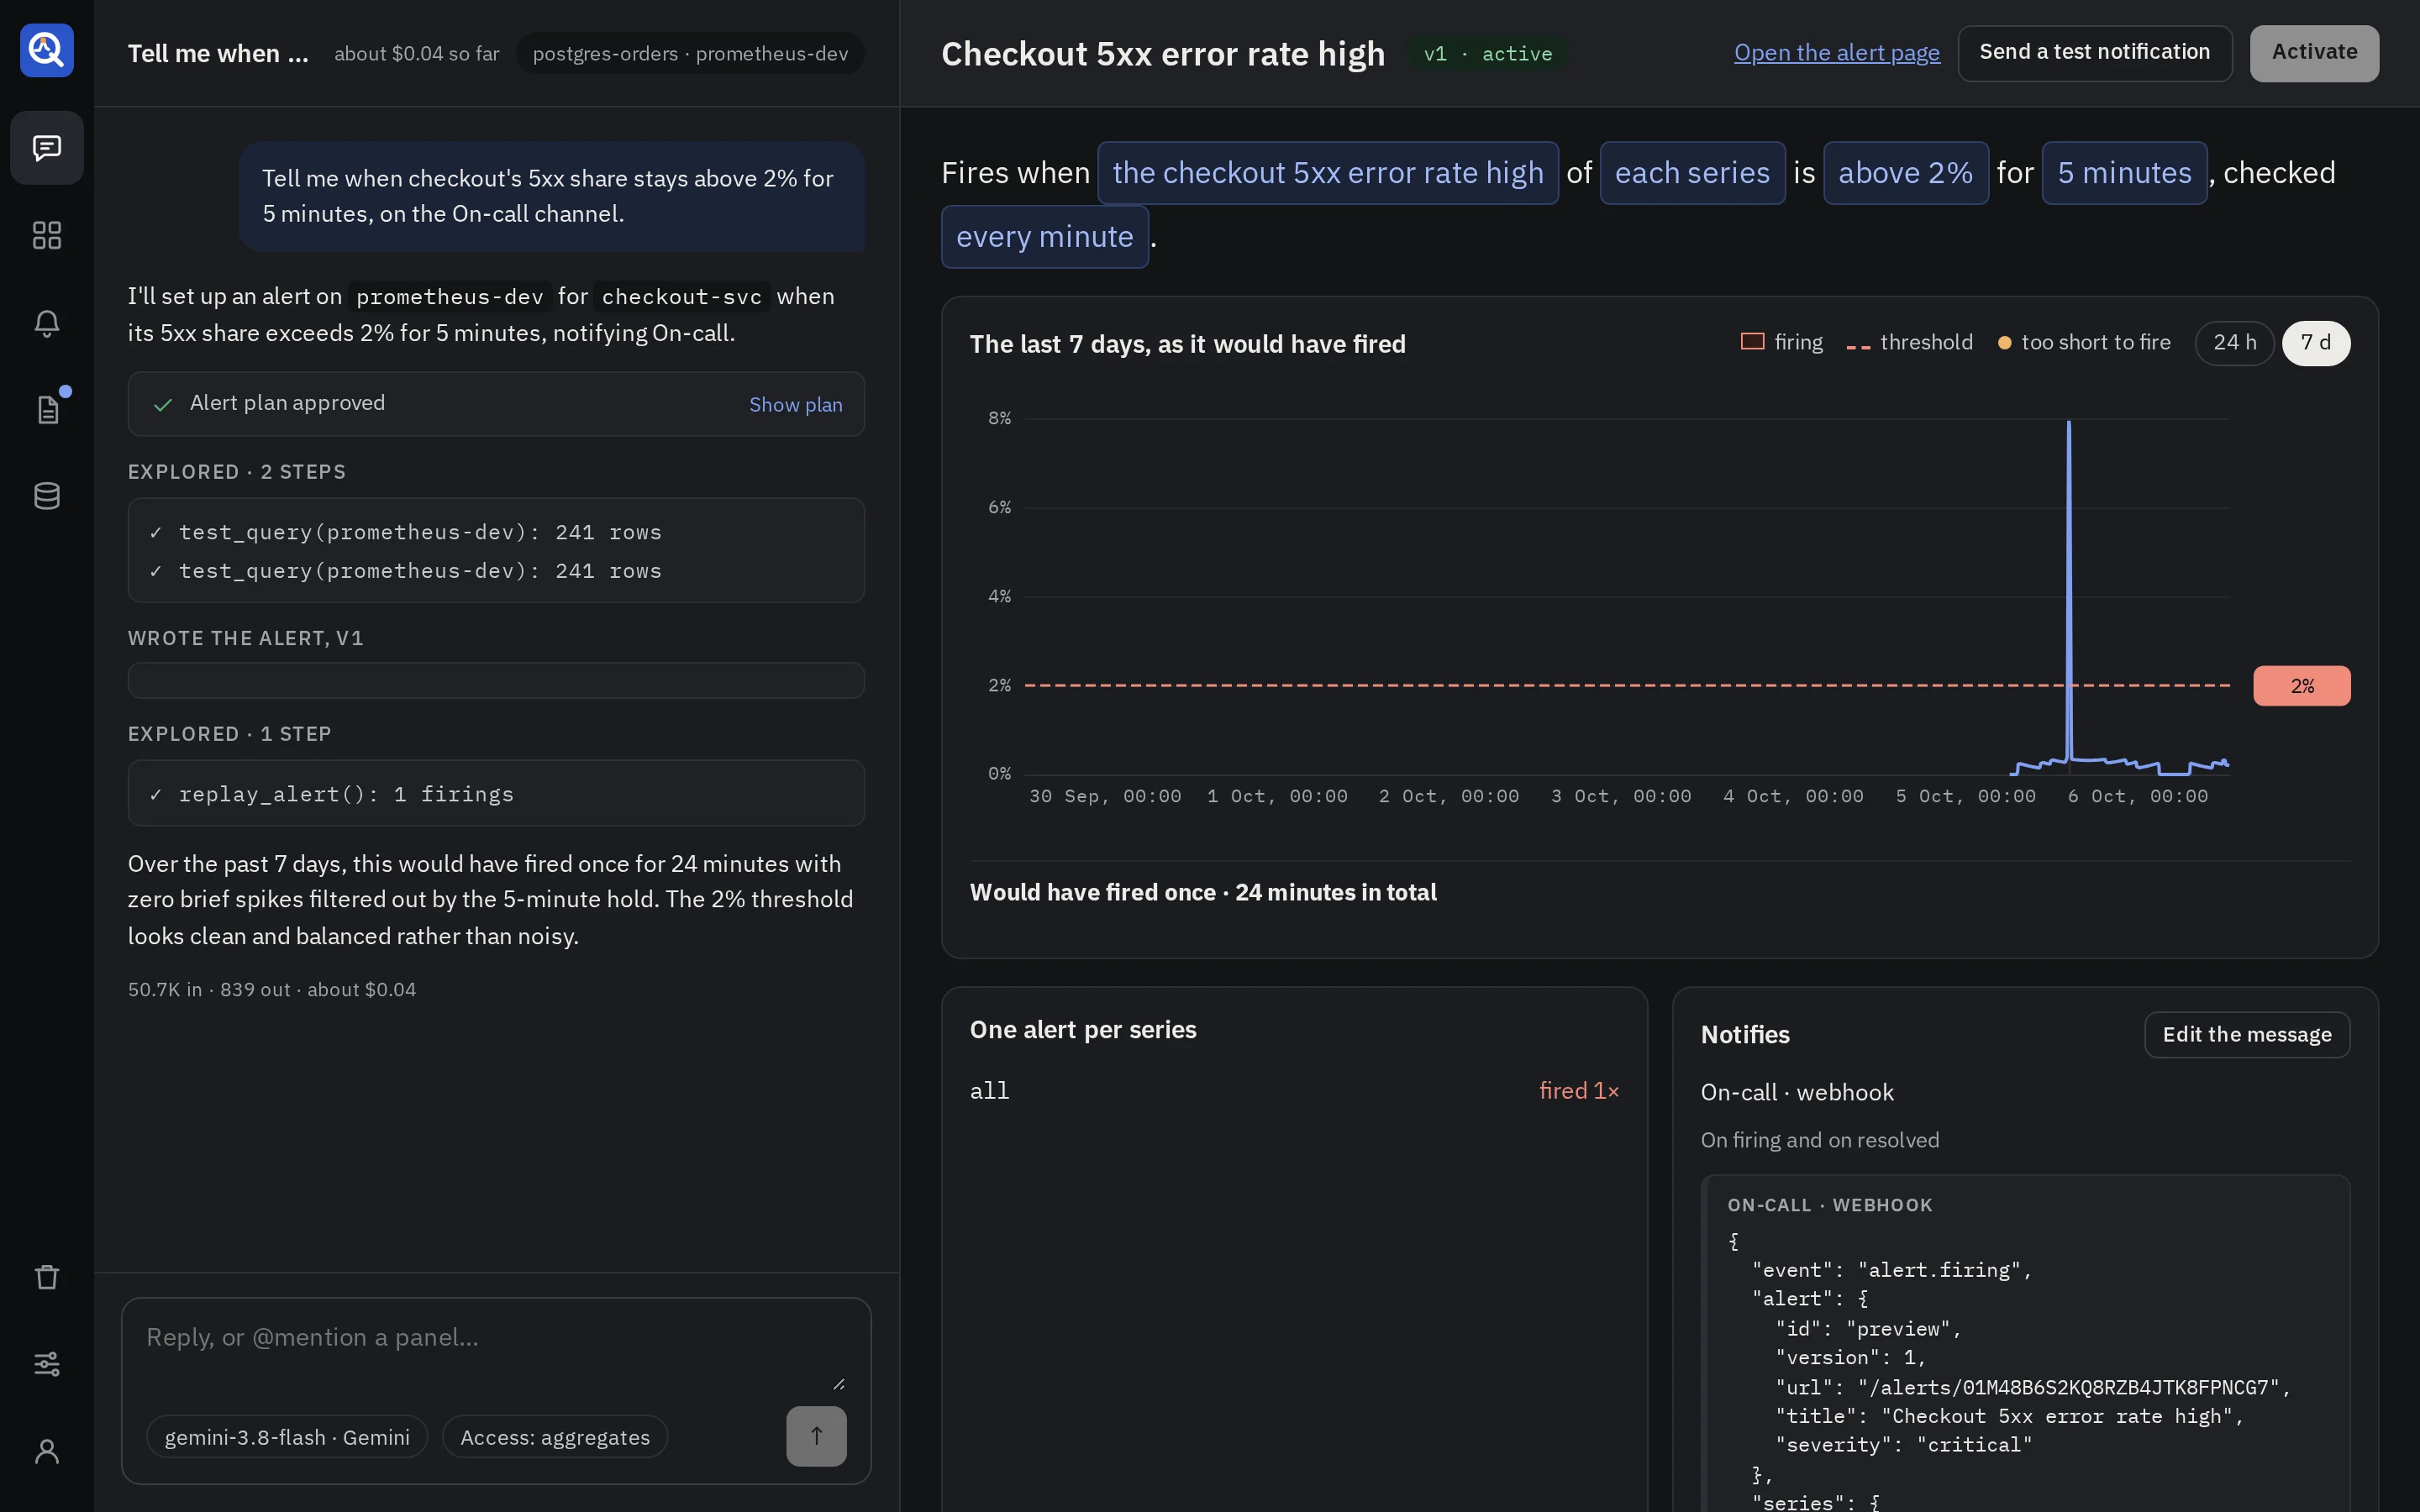
Tell me when checkout’s 5xx share stays above 2% for 5 minutes, on the On-call channel.
From a dashboard, a panel’s info bubble offers Create an alert on this: the alert starts from that panel’s query, and the thread opens with a note naming the panel.
The agent proposes a plan: Watch (what, on which source), Fires when, Checks (how often) and Notifies (the channels). Approve & write, and the alert appears in the draft pane on the right.
Tune the draft
The draft pane shows what the alert would have done, before it ever runs:
- The condition as a sentence: “Fires when the error share of each service is above 2% for 5 minutes, checked every minute”. Each value is a button: click it to change it.
- The replay over the last 7 days or 24 hours, with the threshold as a dashed line. Drag the handle at its right, or use the arrow keys, and the shading, the summary (“Would have fired 2 times · 23 minutes in total · 1 spike too short to fire”) and the series follow at once.
- The series: one per service, host or label value, each with how often it would have fired.
- Notifies: the channels, and a preview of the message as each service shows it: a Slack message, a Discord embed, a Teams card, a PagerDuty incident, a webhook’s JSON. Edit the message changes its title, body and fields.
Every change you make here is saved as a new draft version, and the agent reads it on its next turn (“I changed the alert by hand, v1 → v2: threshold 3% → 2%”). Keep talking to change anything else.
- Send a test notification sends the message to its channels, marked as a test.
- Activate starts checking it. Activating runs its query once, and refuses a query that fails.
What fires
Each check runs the query over a recent window and turns the result into series: one per row of label values, or one per time series.
- A series above (or below) the threshold is pending, then firing once that held for the wait you set. A wait of 0 fires at once.
- When it stops holding, it is resolved: the channel hears so, unless you turned that off.
- While it keeps firing, the alert can repeat its message at an interval you set.
- No data: an alert can fire when the query returns nothing for a while.
- Cannot be checked: when the query fails twice in a row, the source down or the credentials wrong, the channel hears once, and again when it can be checked. An admin can turn that off.
The alerts list
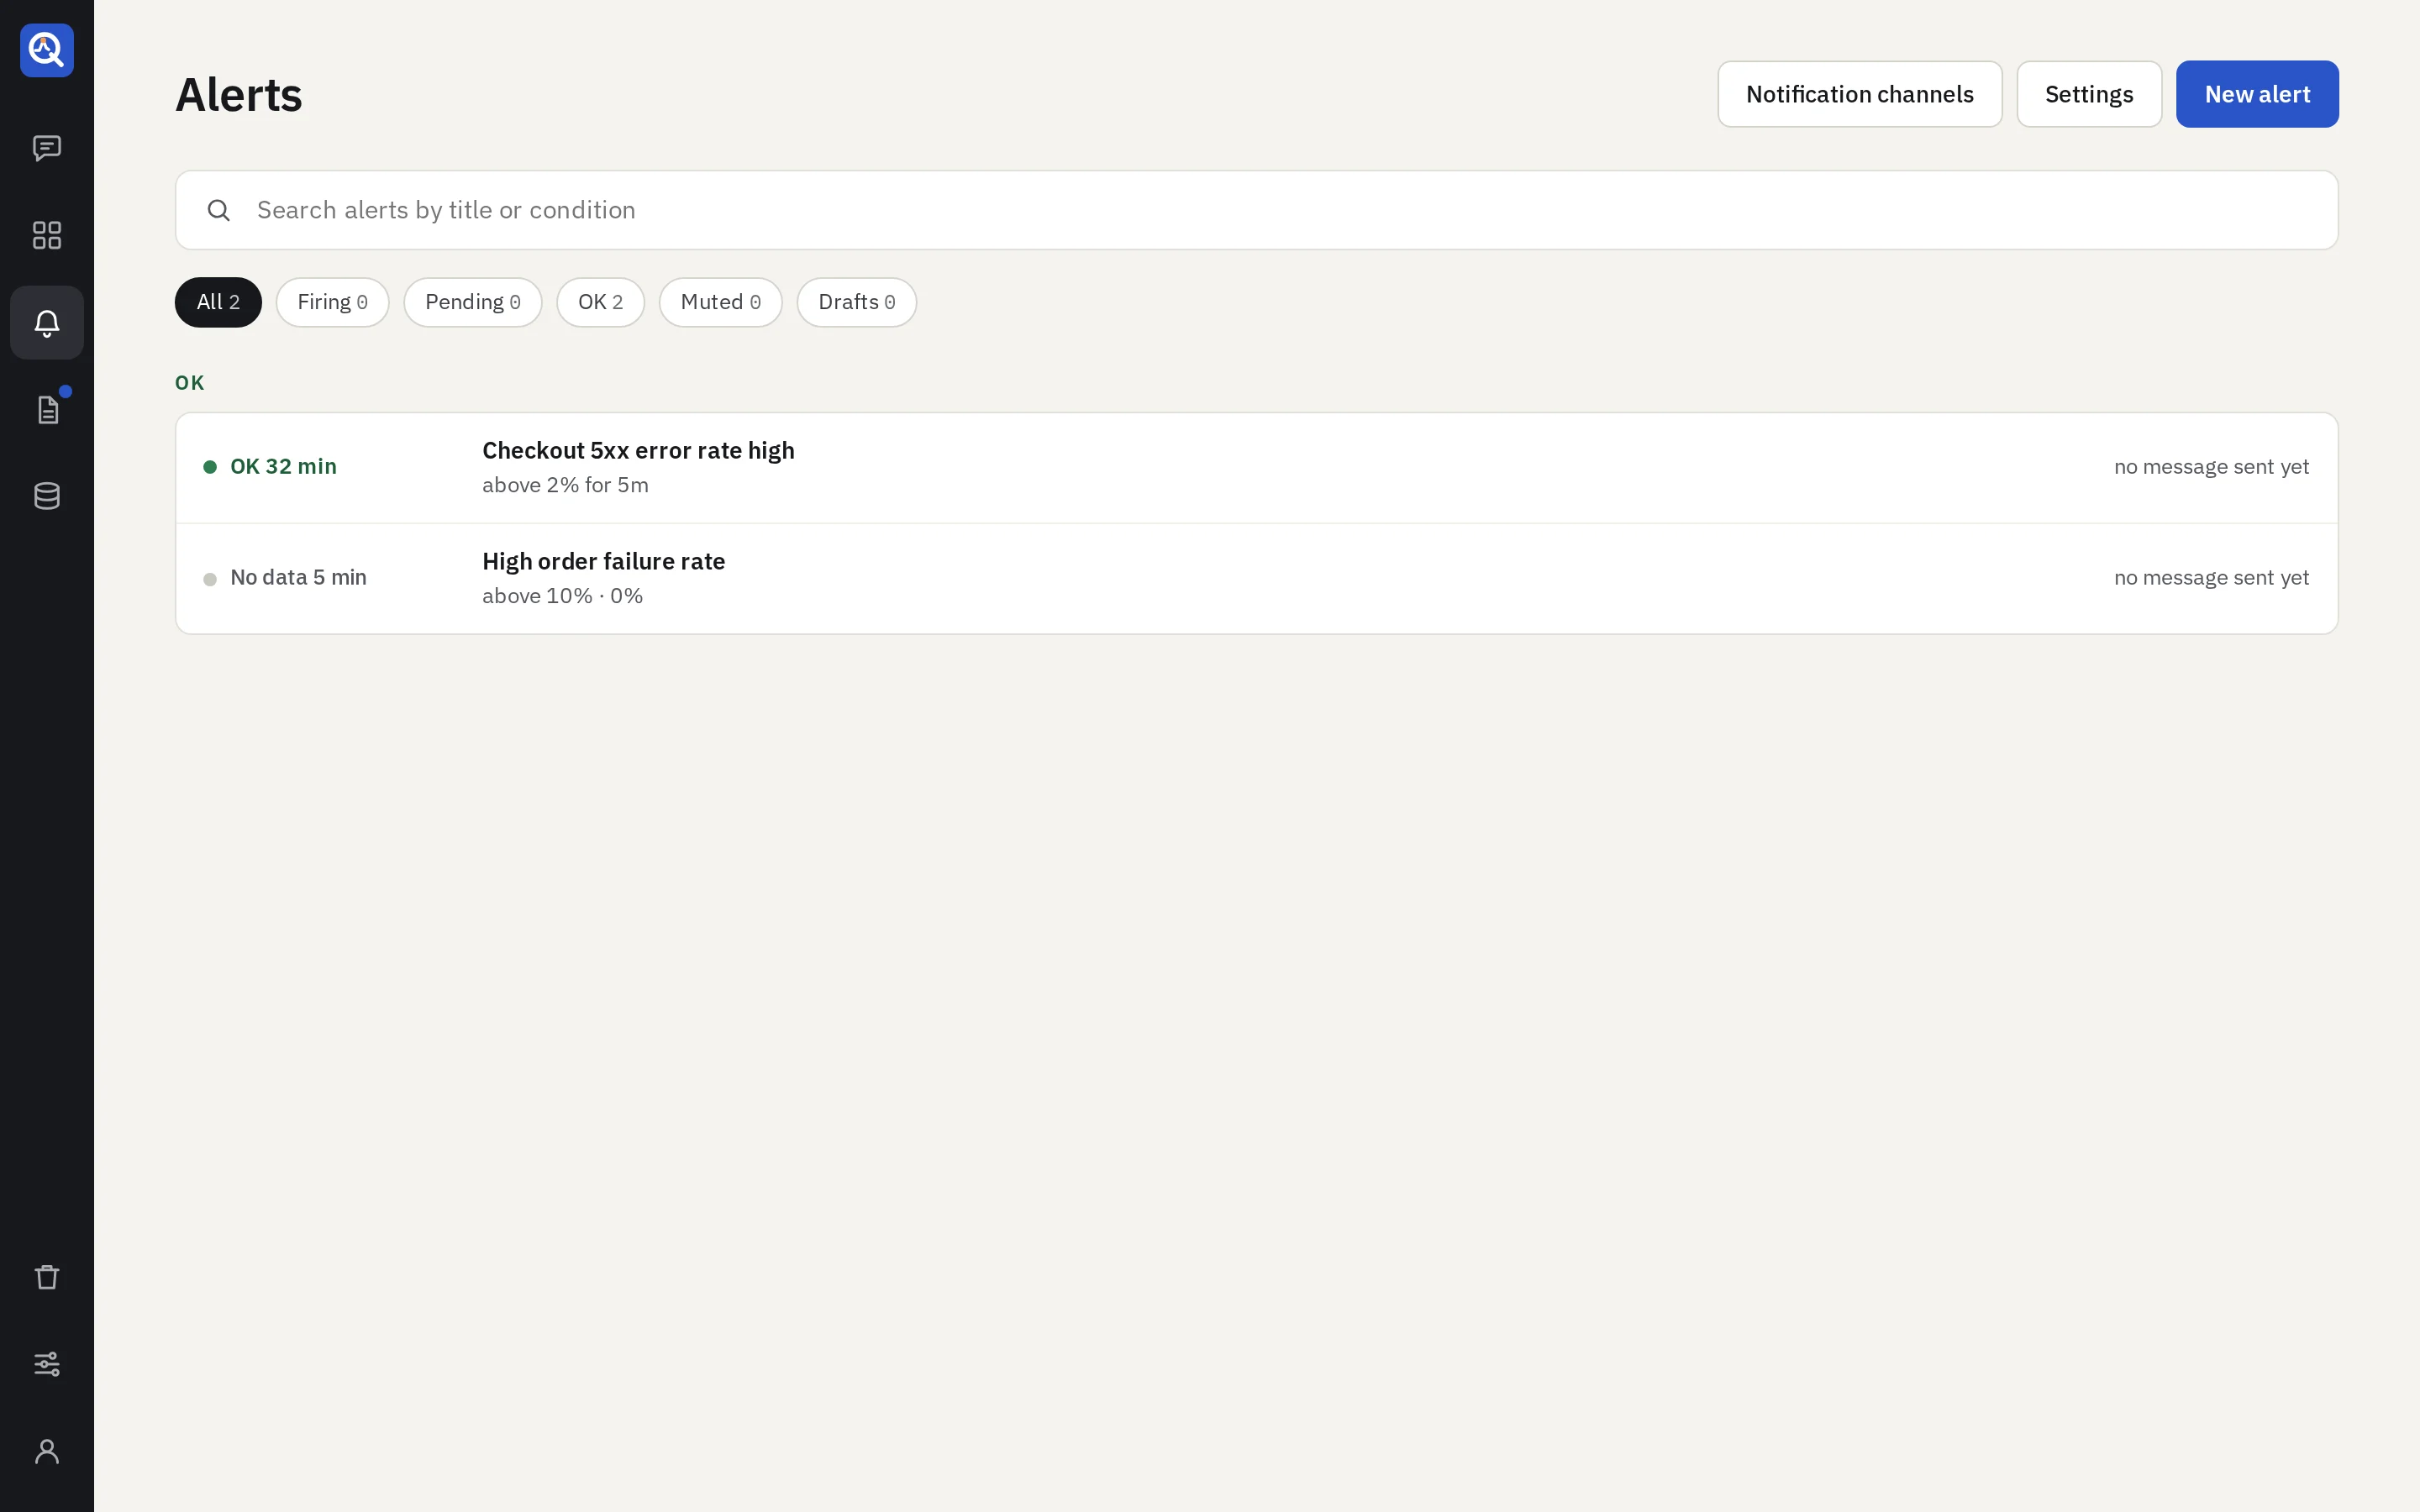
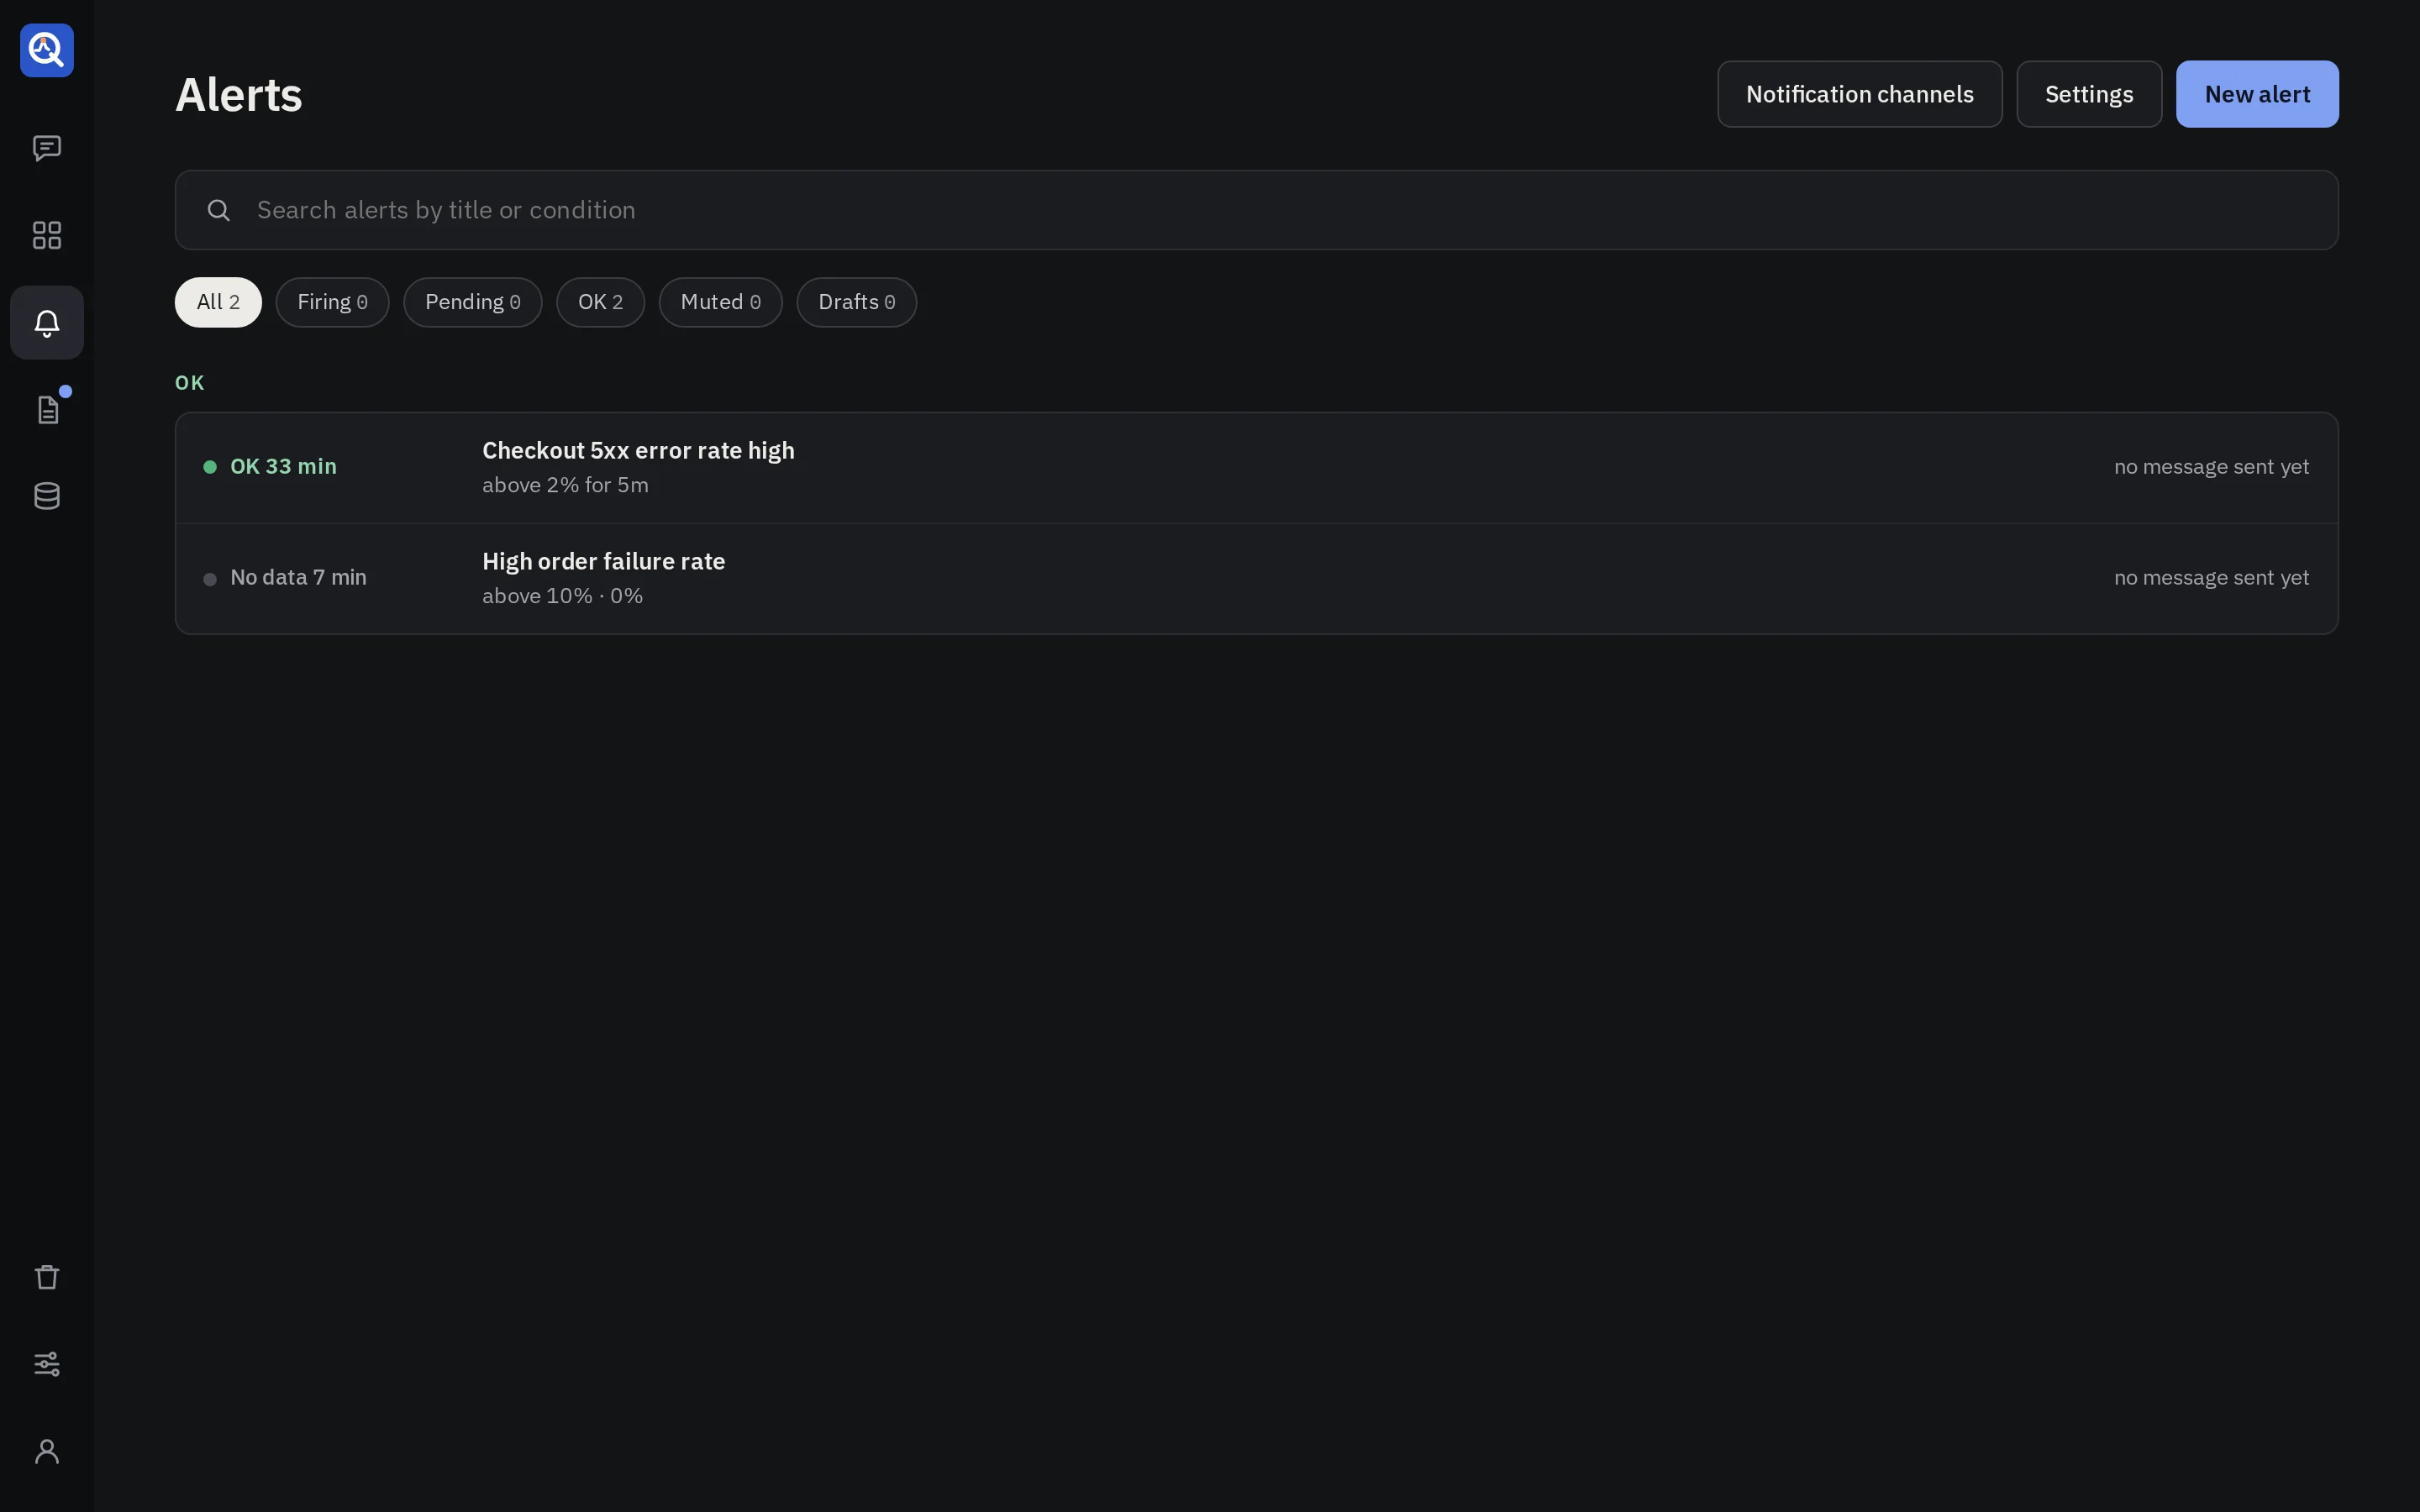
Alerts lists them by state: Firing, Pending and OK, then Drafts and Deactivated. Each row
shows its state and since when, the condition (above 2% for 5m), the worst series with its value,
and the latest message sent. Search and the state filter narrow it. The rail’s Alerts carries the
number of alerts firing.
An alert’s page
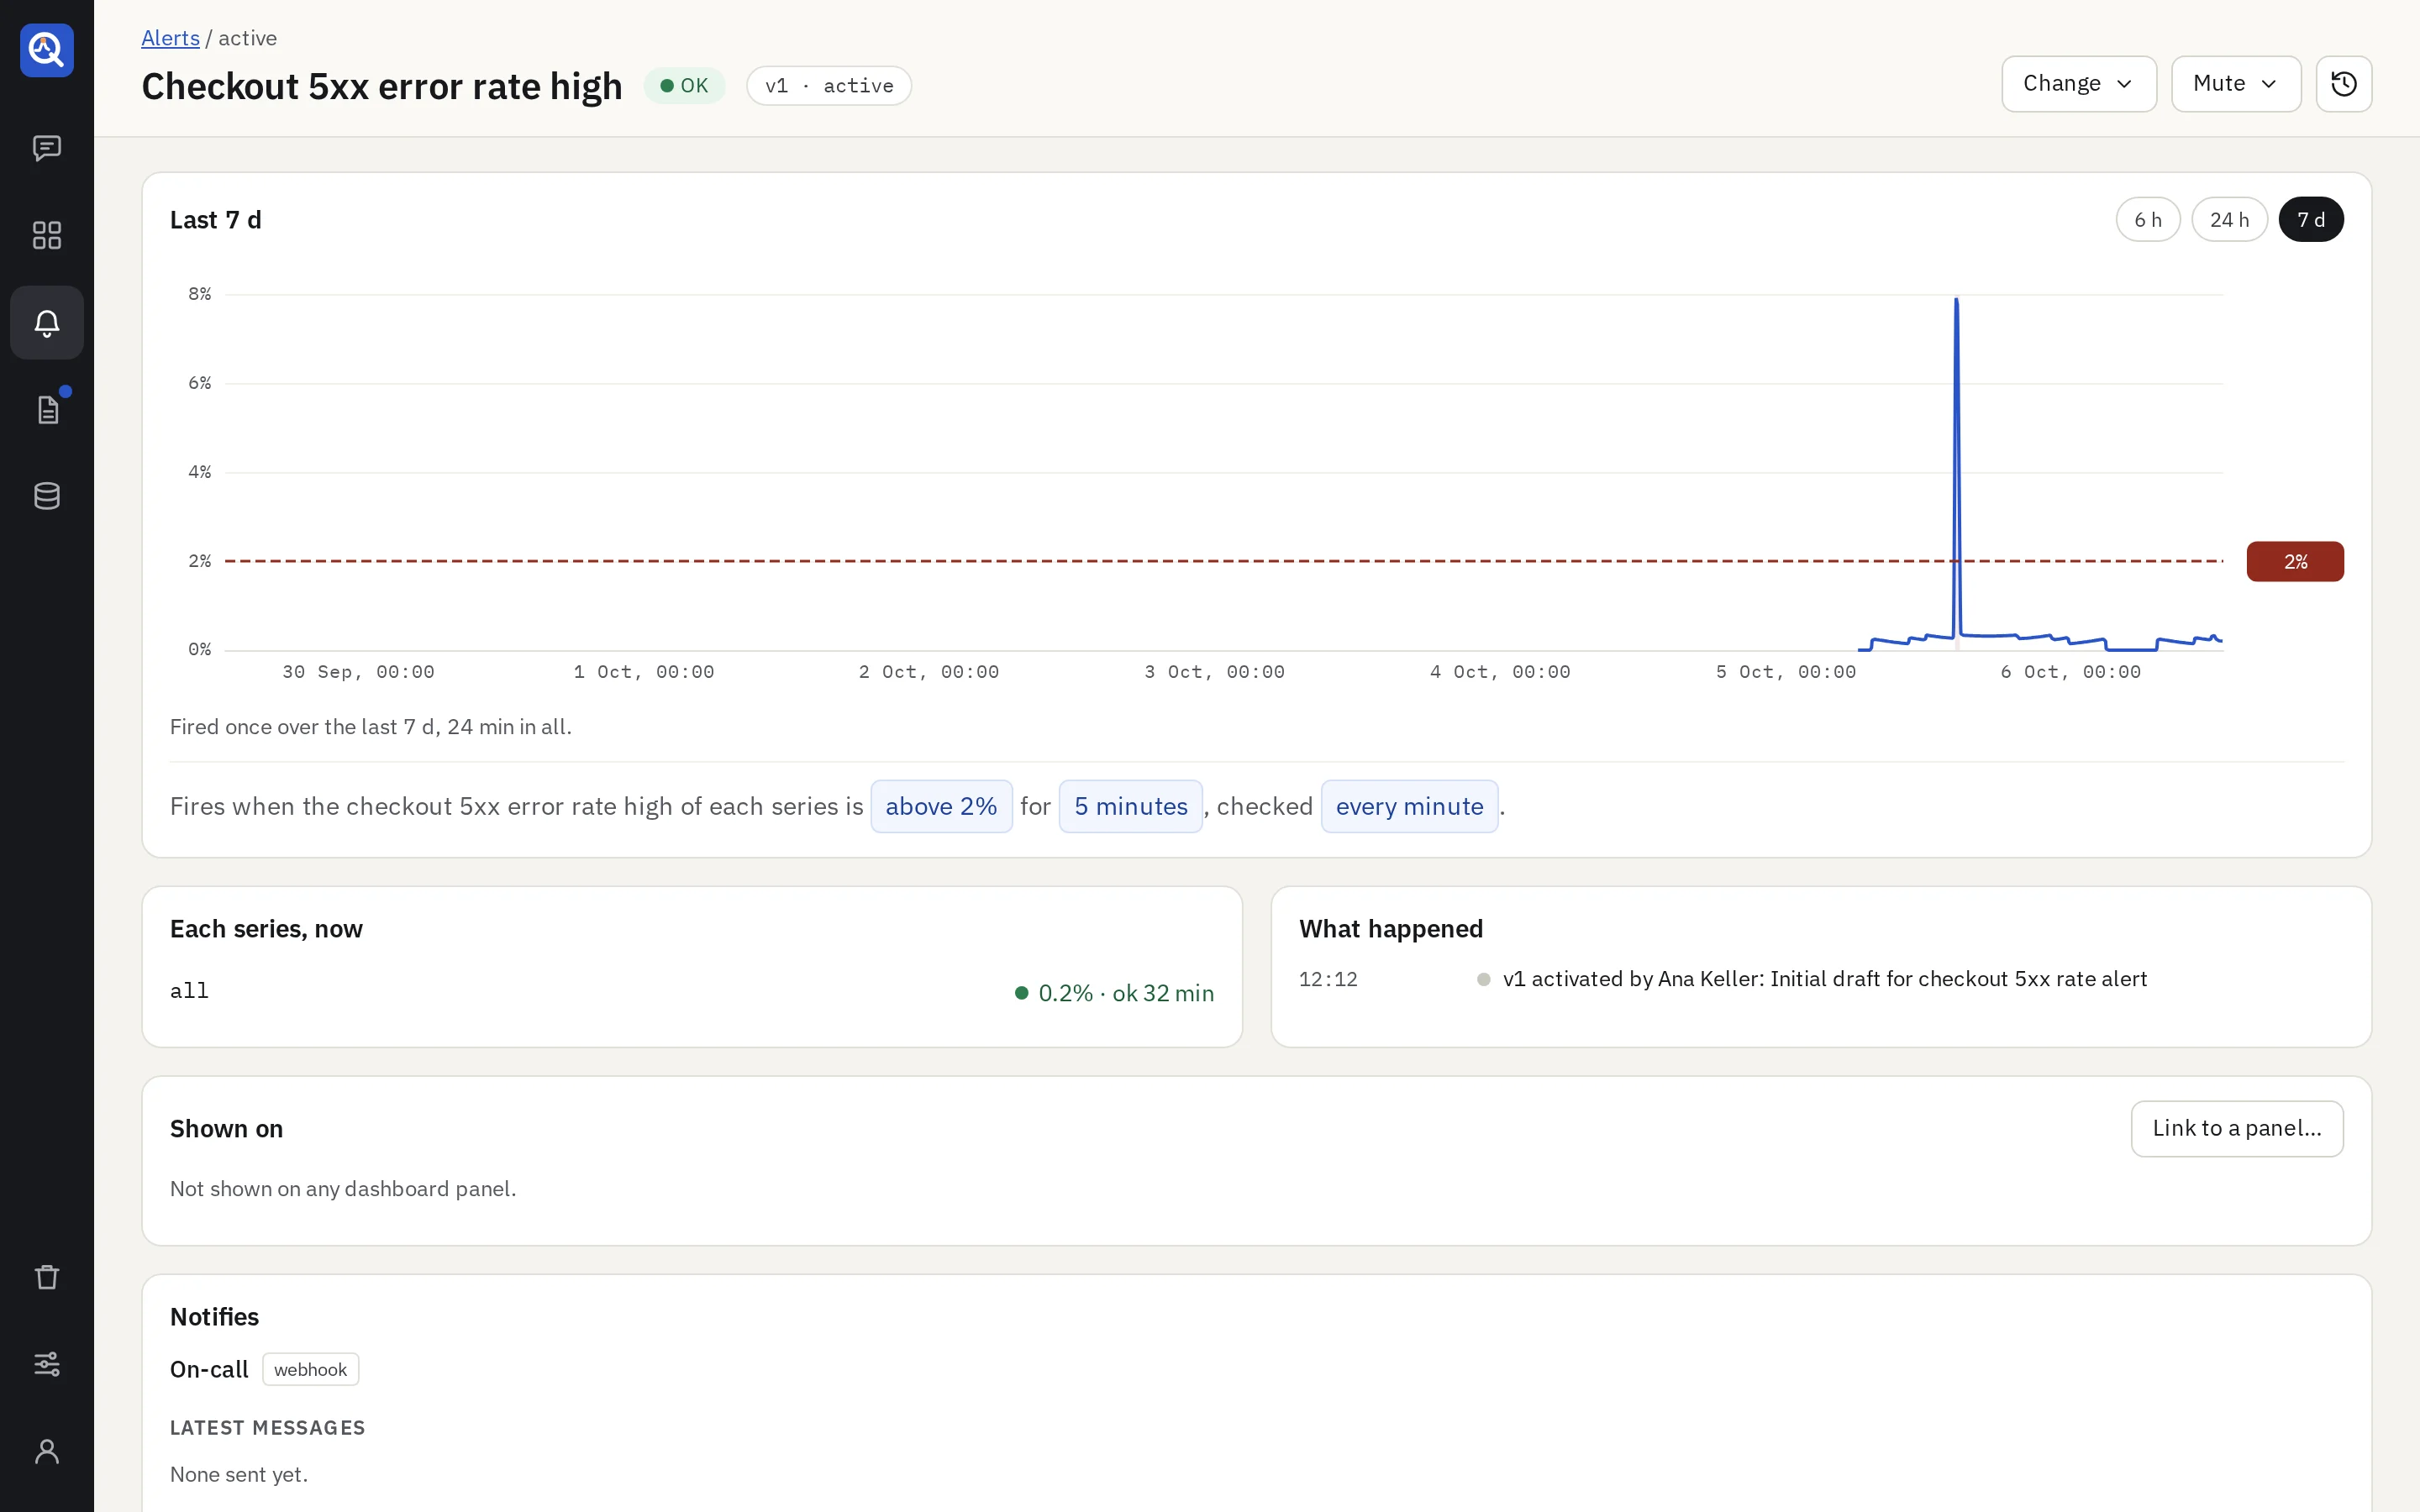
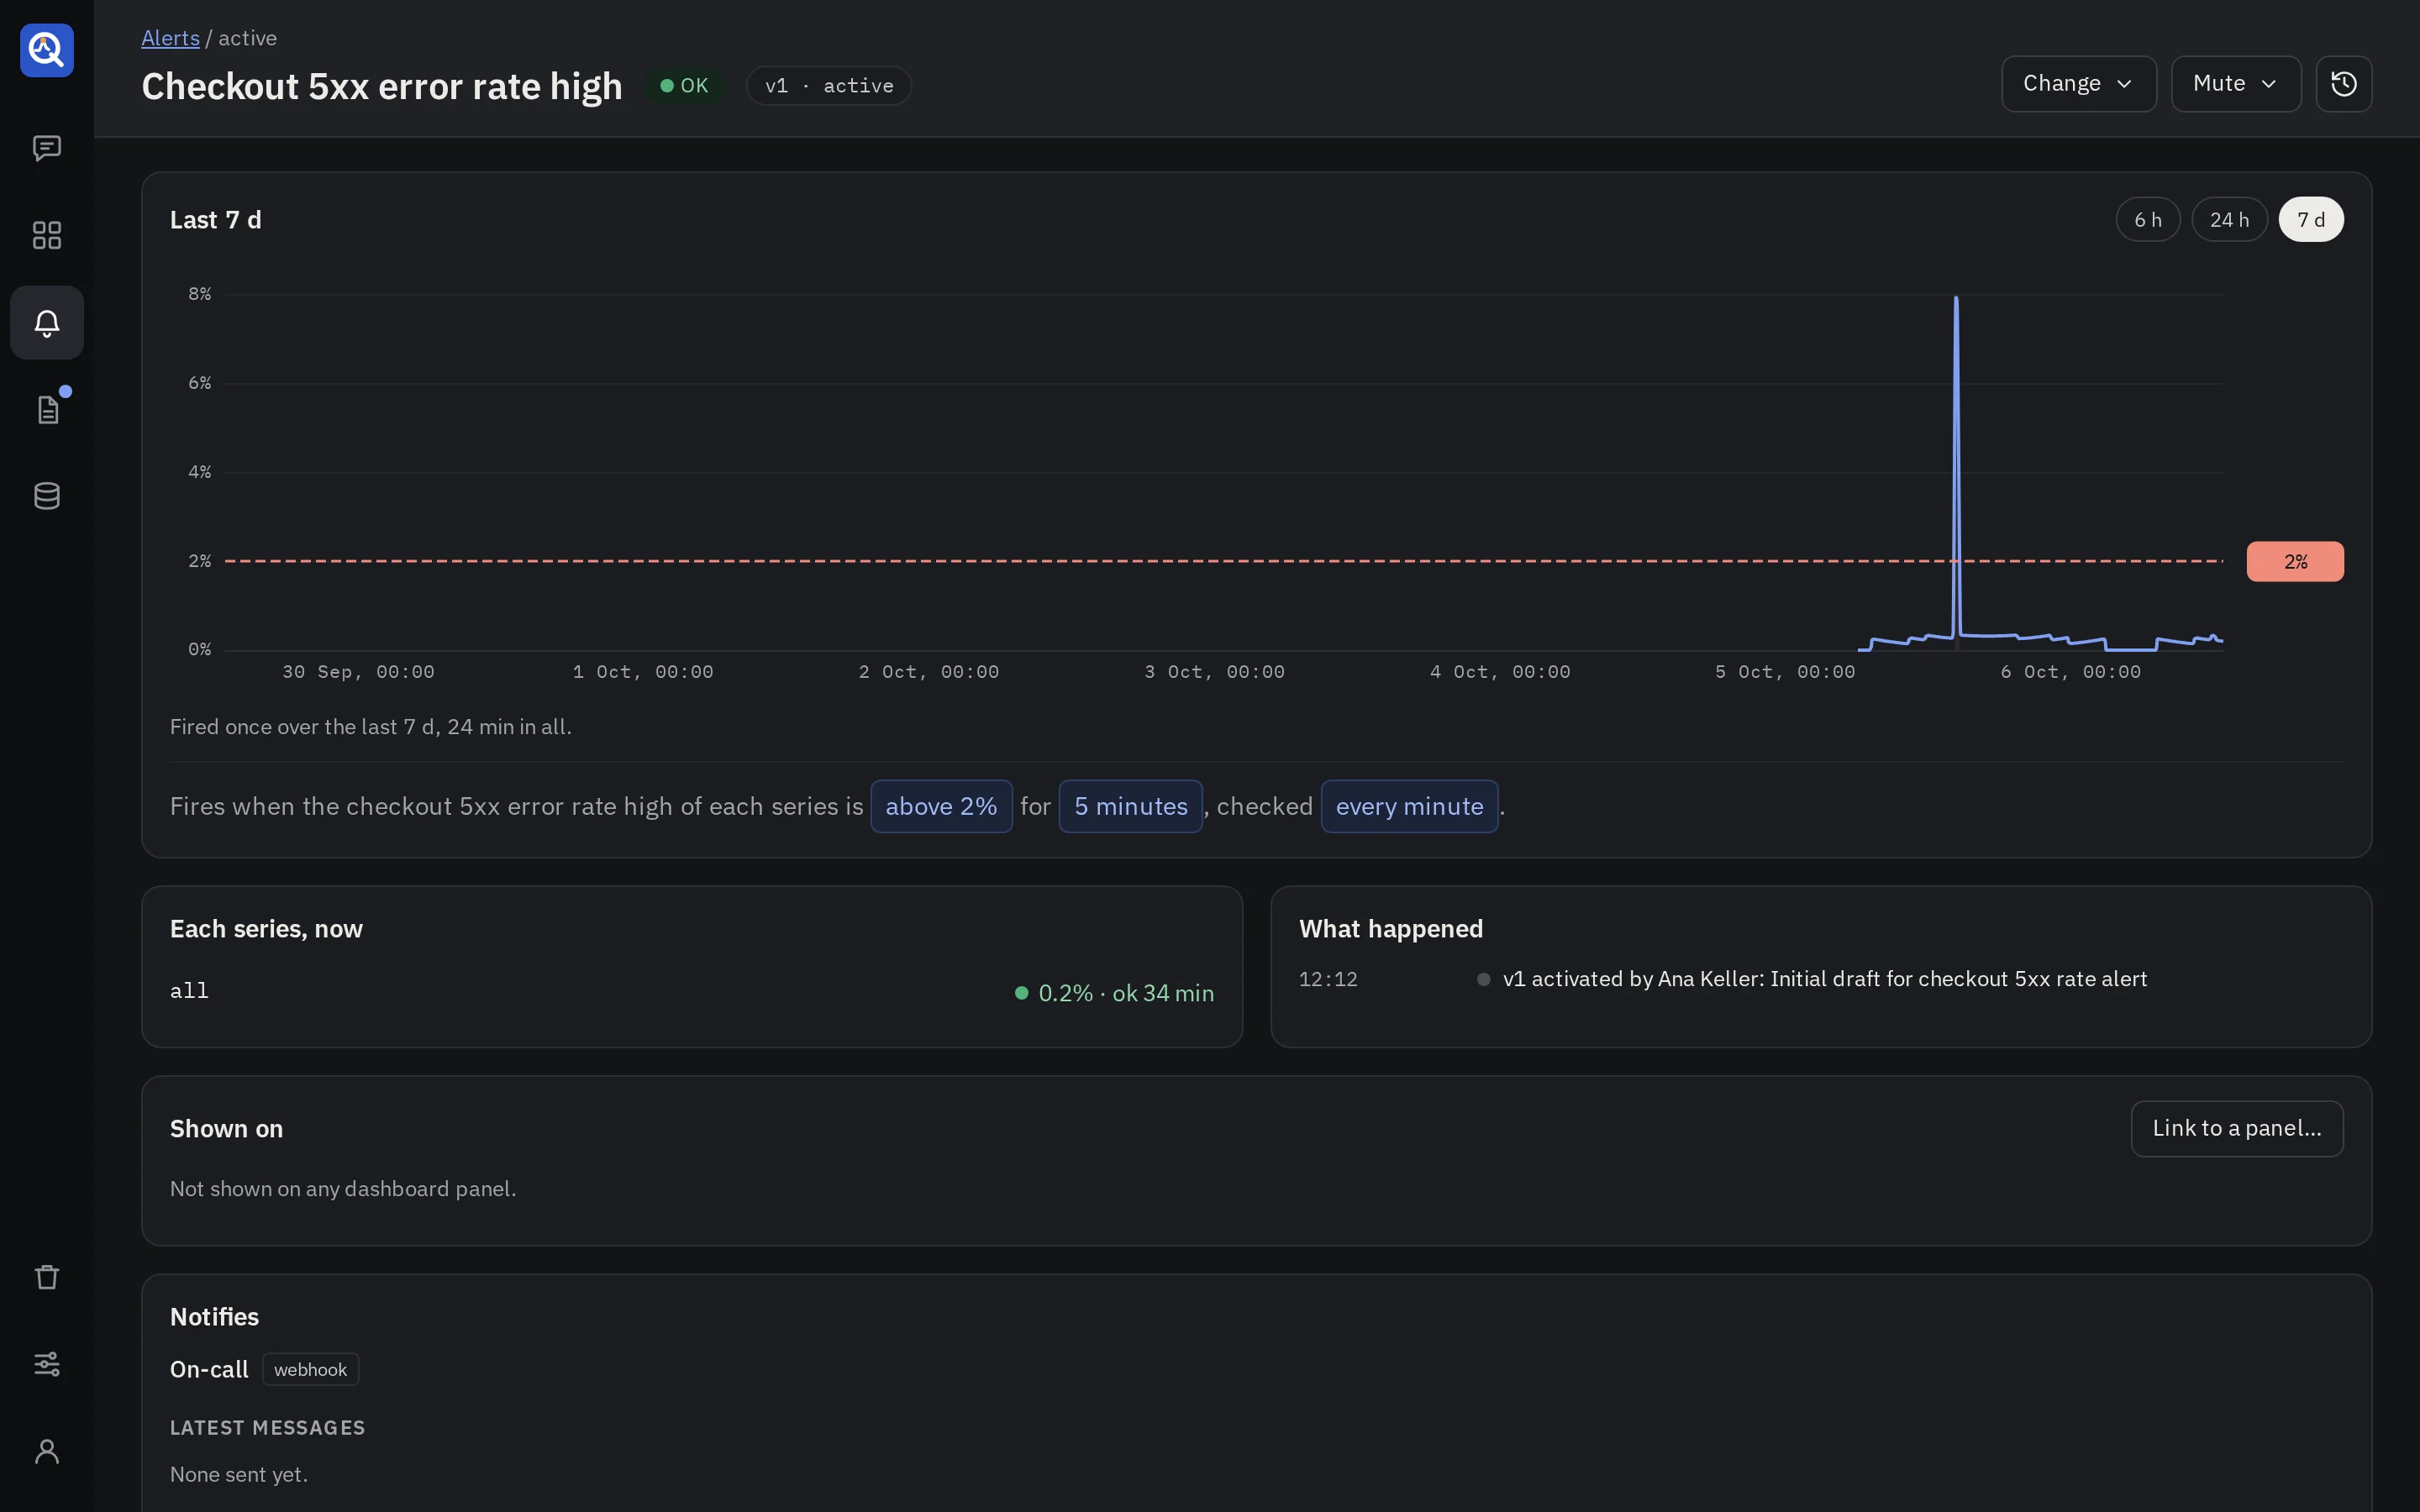
- The chart replays the shown version over 6 hours, 24 hours or 7 days, with the threshold and the firing periods.
- Series gives each series’ state, value and since when.
- What happened lists the changes of state, whether each notified, the times it could not be checked, and who activated, deactivated, muted or unmuted it.
- Notifies lists the channels and the latest messages, with whether they got through.
- Shown on lists the dashboard panels it is linked to.
Tune a live alert
Editors drag the threshold, or change the wait or the interval, right on the page. Nothing is saved yet: an amber bar says what the change would do (“Not saved: threshold 2% → 2.5%. Last 7 days: would have fired 1 time instead of 2. Right now: checkout-svc would stop firing.”). Discard drops it; Activate as v4 saves and activates it as a new version.
The header’s actions
- Mute (analysts and above): for 1 hour, 4 hours, until tomorrow 09:00, or until a time within 7 days. Editors may also mute until someone unmutes. A muted alert is still checked; it only stays quiet. A series still firing when the mute ends notifies then.
- Change (editors): Edit with the agent opens its thread; Deactivate stops checking it and resolves what was firing, so PagerDuty closes its incident; Activate starts it again.
- Versions: who saved each and when. Editors activate another one.
Alerts on dashboards
An alert can be linked to the panels that show the same thing. A linked panel shows the alert’s state in its header, and its time chart draws the threshold and the firing periods. A toggle in the variables row hides them.
- The agent offers a link when an alert’s query matches a pinned panel’s. Only your Link makes it.
- On the alert’s page, Link to a panel… picks one by hand, and quanthea suggests the panels whose query matches, to Link or Dismiss.
Settings
Admins open Settings on the Alerts page:
- The most alerts active per connector, 50 by default, so a source isn’t checked to death.
- Notify when an alert cannot be checked or a report fails, on by default.
Messages go to the channels admins set up in Notifications. Without a channel, an alert still fires on its page; the agent says an admin can add one.