


Getting started
This page takes you from nothing to a first dashboard in about ten minutes: run quanthea, sign in, give it a model and a data source, and ask for a dashboard.
1. Run it
quanthea is one Docker image. It keeps its database in one volume and its keys in another.
docker run -d --name quanthea -p 3000:3000 \
  -v quanthea-data:/data \
  -v quanthea-keys:/keys \
  ghcr.io/jboix/quanthea
The first start creates the user admin and writes its password to the log, once:
docker logs quanthea 2>&1 | grep passwordTo declare users, sources and the model in a file instead, see Deploy and the configuration file.
2. Sign in
Open http://localhost:3000 and sign in as admin with the password from the log. quanthea then
asks for your own name, email and password. Nothing else opens until you set them, so a fresh
instance never stays on a password that sat in a log.
3. Add a model
The agent that builds dashboards needs a model. Pinned dashboards never use one.
- Open Settings → Model and add a provider: Anthropic, OpenAI, Mistral, or any OpenAI-compatible endpoint such as LiteLLM, Ollama, OpenRouter or Gemini.
- Paste its API key. quanthea seals it and shows it masked from then on.
- Pick the model for each job. Building needs a strong tool-calling model; talking, planning and tagging can use a cheaper one.
Models and usage explains each job, the limits and the costs.
4. Add a data source
- Open Connectors → Add a connector and pick the kind: PostgreSQL, Prometheus, Loki, ClickHouse, Elasticsearch, MongoDB and more.
- Fill in the connection. Use a read-only account: quanthea only reads, and a read-only role is the hard guarantee.
- Choose the access level: how much of the data the model may see while it builds. The default, schema and metadata, lets it see the tables and their columns, never the rows.
- Save. quanthea tests the connection and reads the schema.
Data sources covers access levels, hidden fields and guardrails.
5. Ask for a dashboard
Open Threads, keep A dashboard selected, and describe what you want to see:
What happened to checkout yesterday around 14:00? Show the error rate and p95 latency per service, and mark the deploys on the charts.
The agent reads the schema, then proposes a plan: the panels it will build and what each shows. Approve it, and the dashboard builds beside the conversation, every query test-run against your source. Ask for changes in the same thread, then Pin the version you want to keep.
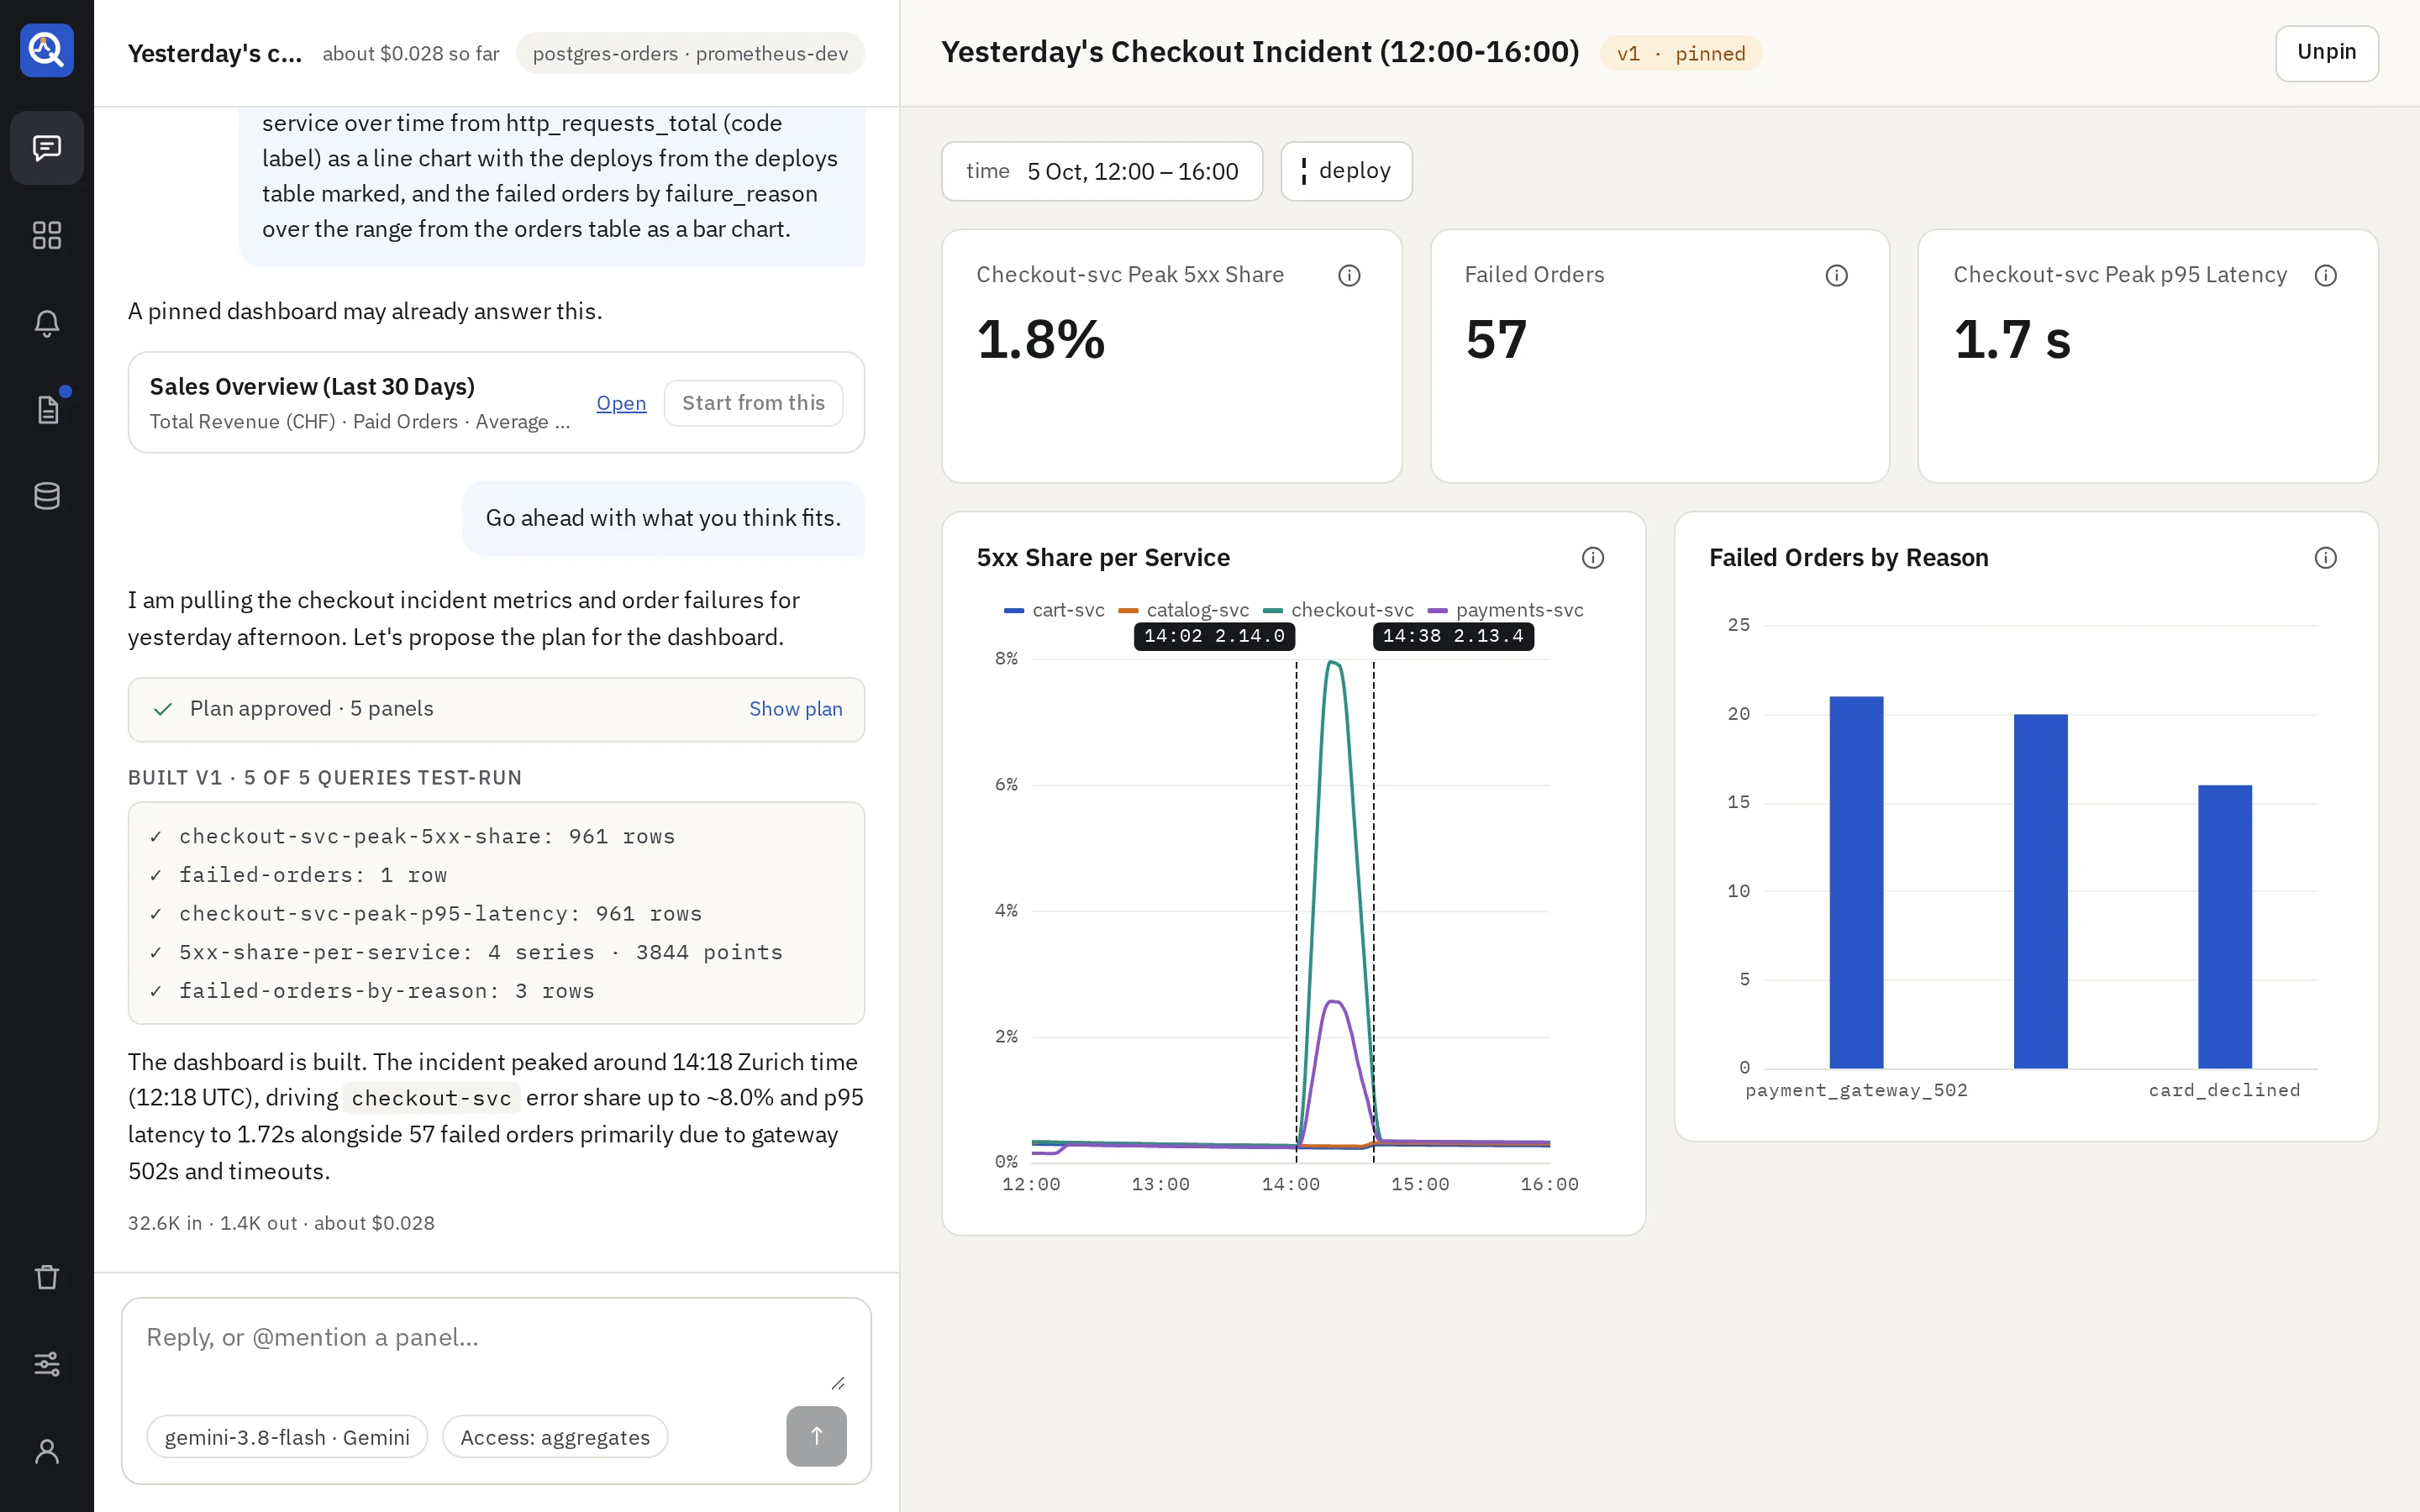
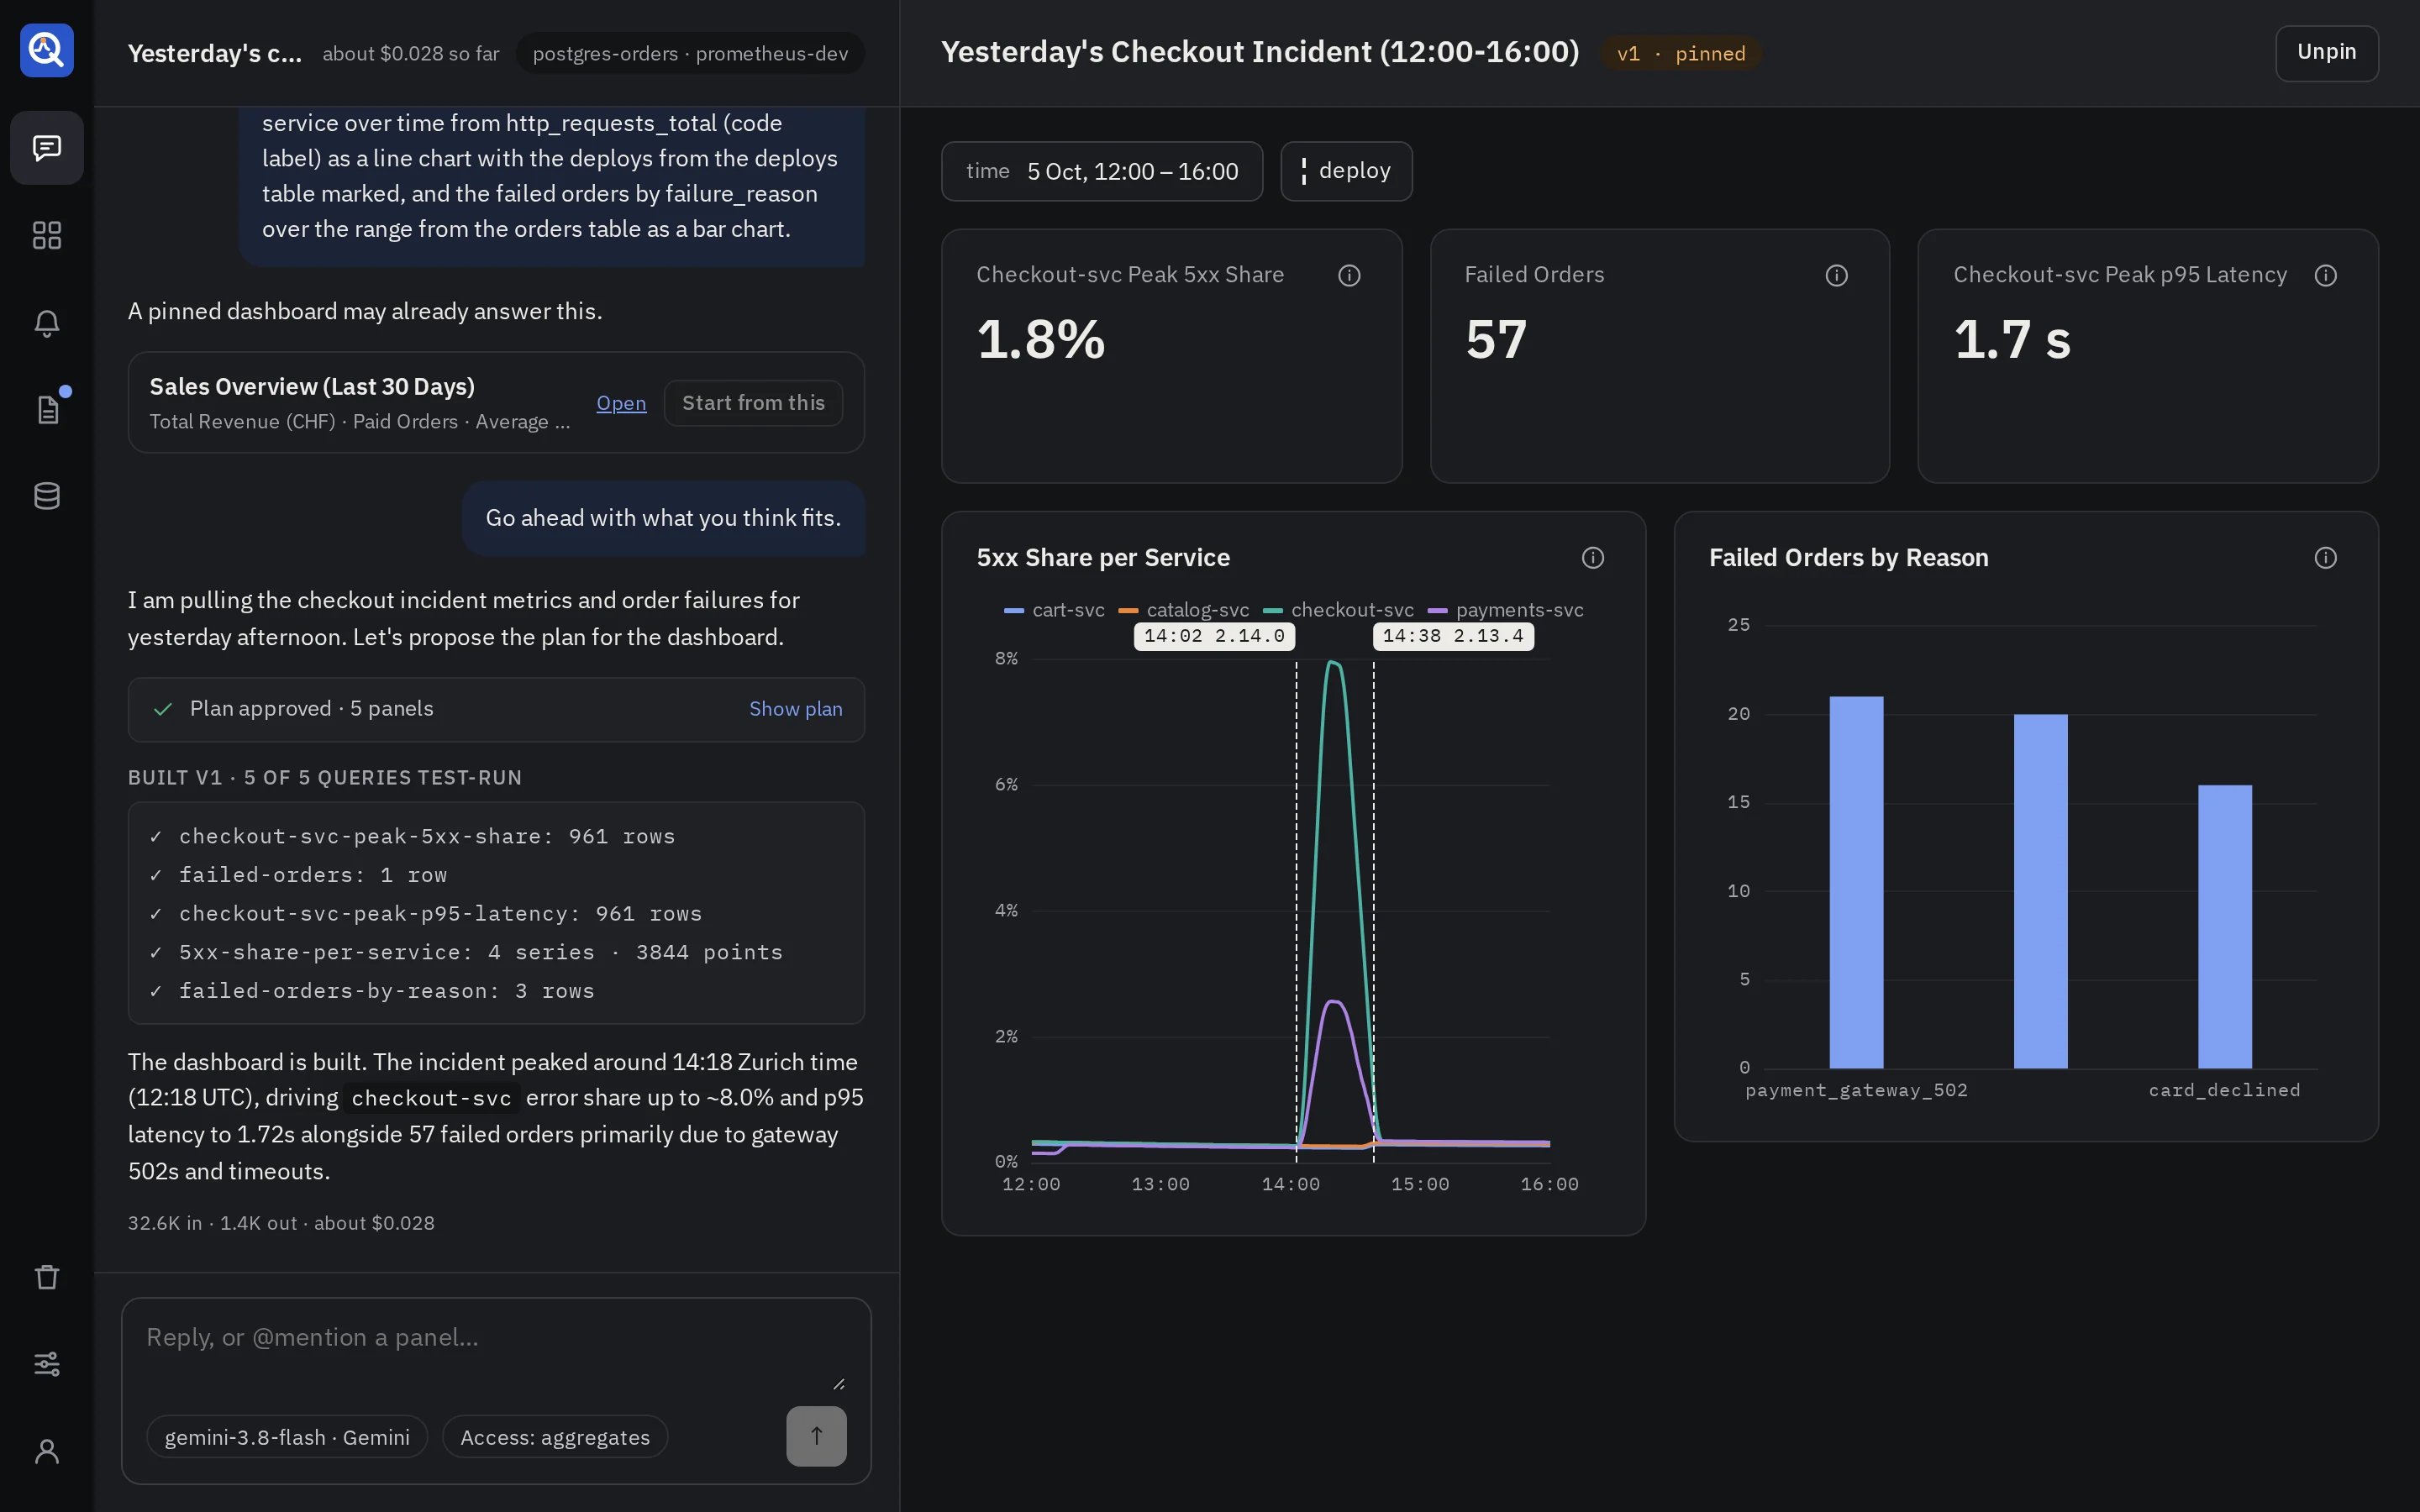
Dashboards walks through the thread, the plan and pinning.
6. Invite your team
Open Settings → Users → Invite someone. Each person gets a role:
| Role | What they do |
|---|---|
| Viewer | Reads pinned dashboards, alerts, reports and snapshots. |
| Analyst | Also asks questions about dashboards and has panels explained. |
| Editor | Also builds dashboards, alerts and reports, pins and takes snapshots. |
| Admin | Also manages sources, models, users, sign-in and settings. |
They choose their own password from the link you send them, or sign in through GitHub, Google, GitLab or Microsoft Entra ID once you add one. See Users and sign-in.