


Data sources
A connector is one data source quanthea reads: a PostgreSQL database, a Prometheus server, a Loki instance, an HTTP API. Admins add and tune them in Connectors. Each connector says how much of its data the model may see, which columns it never sees, and how far a query may go.
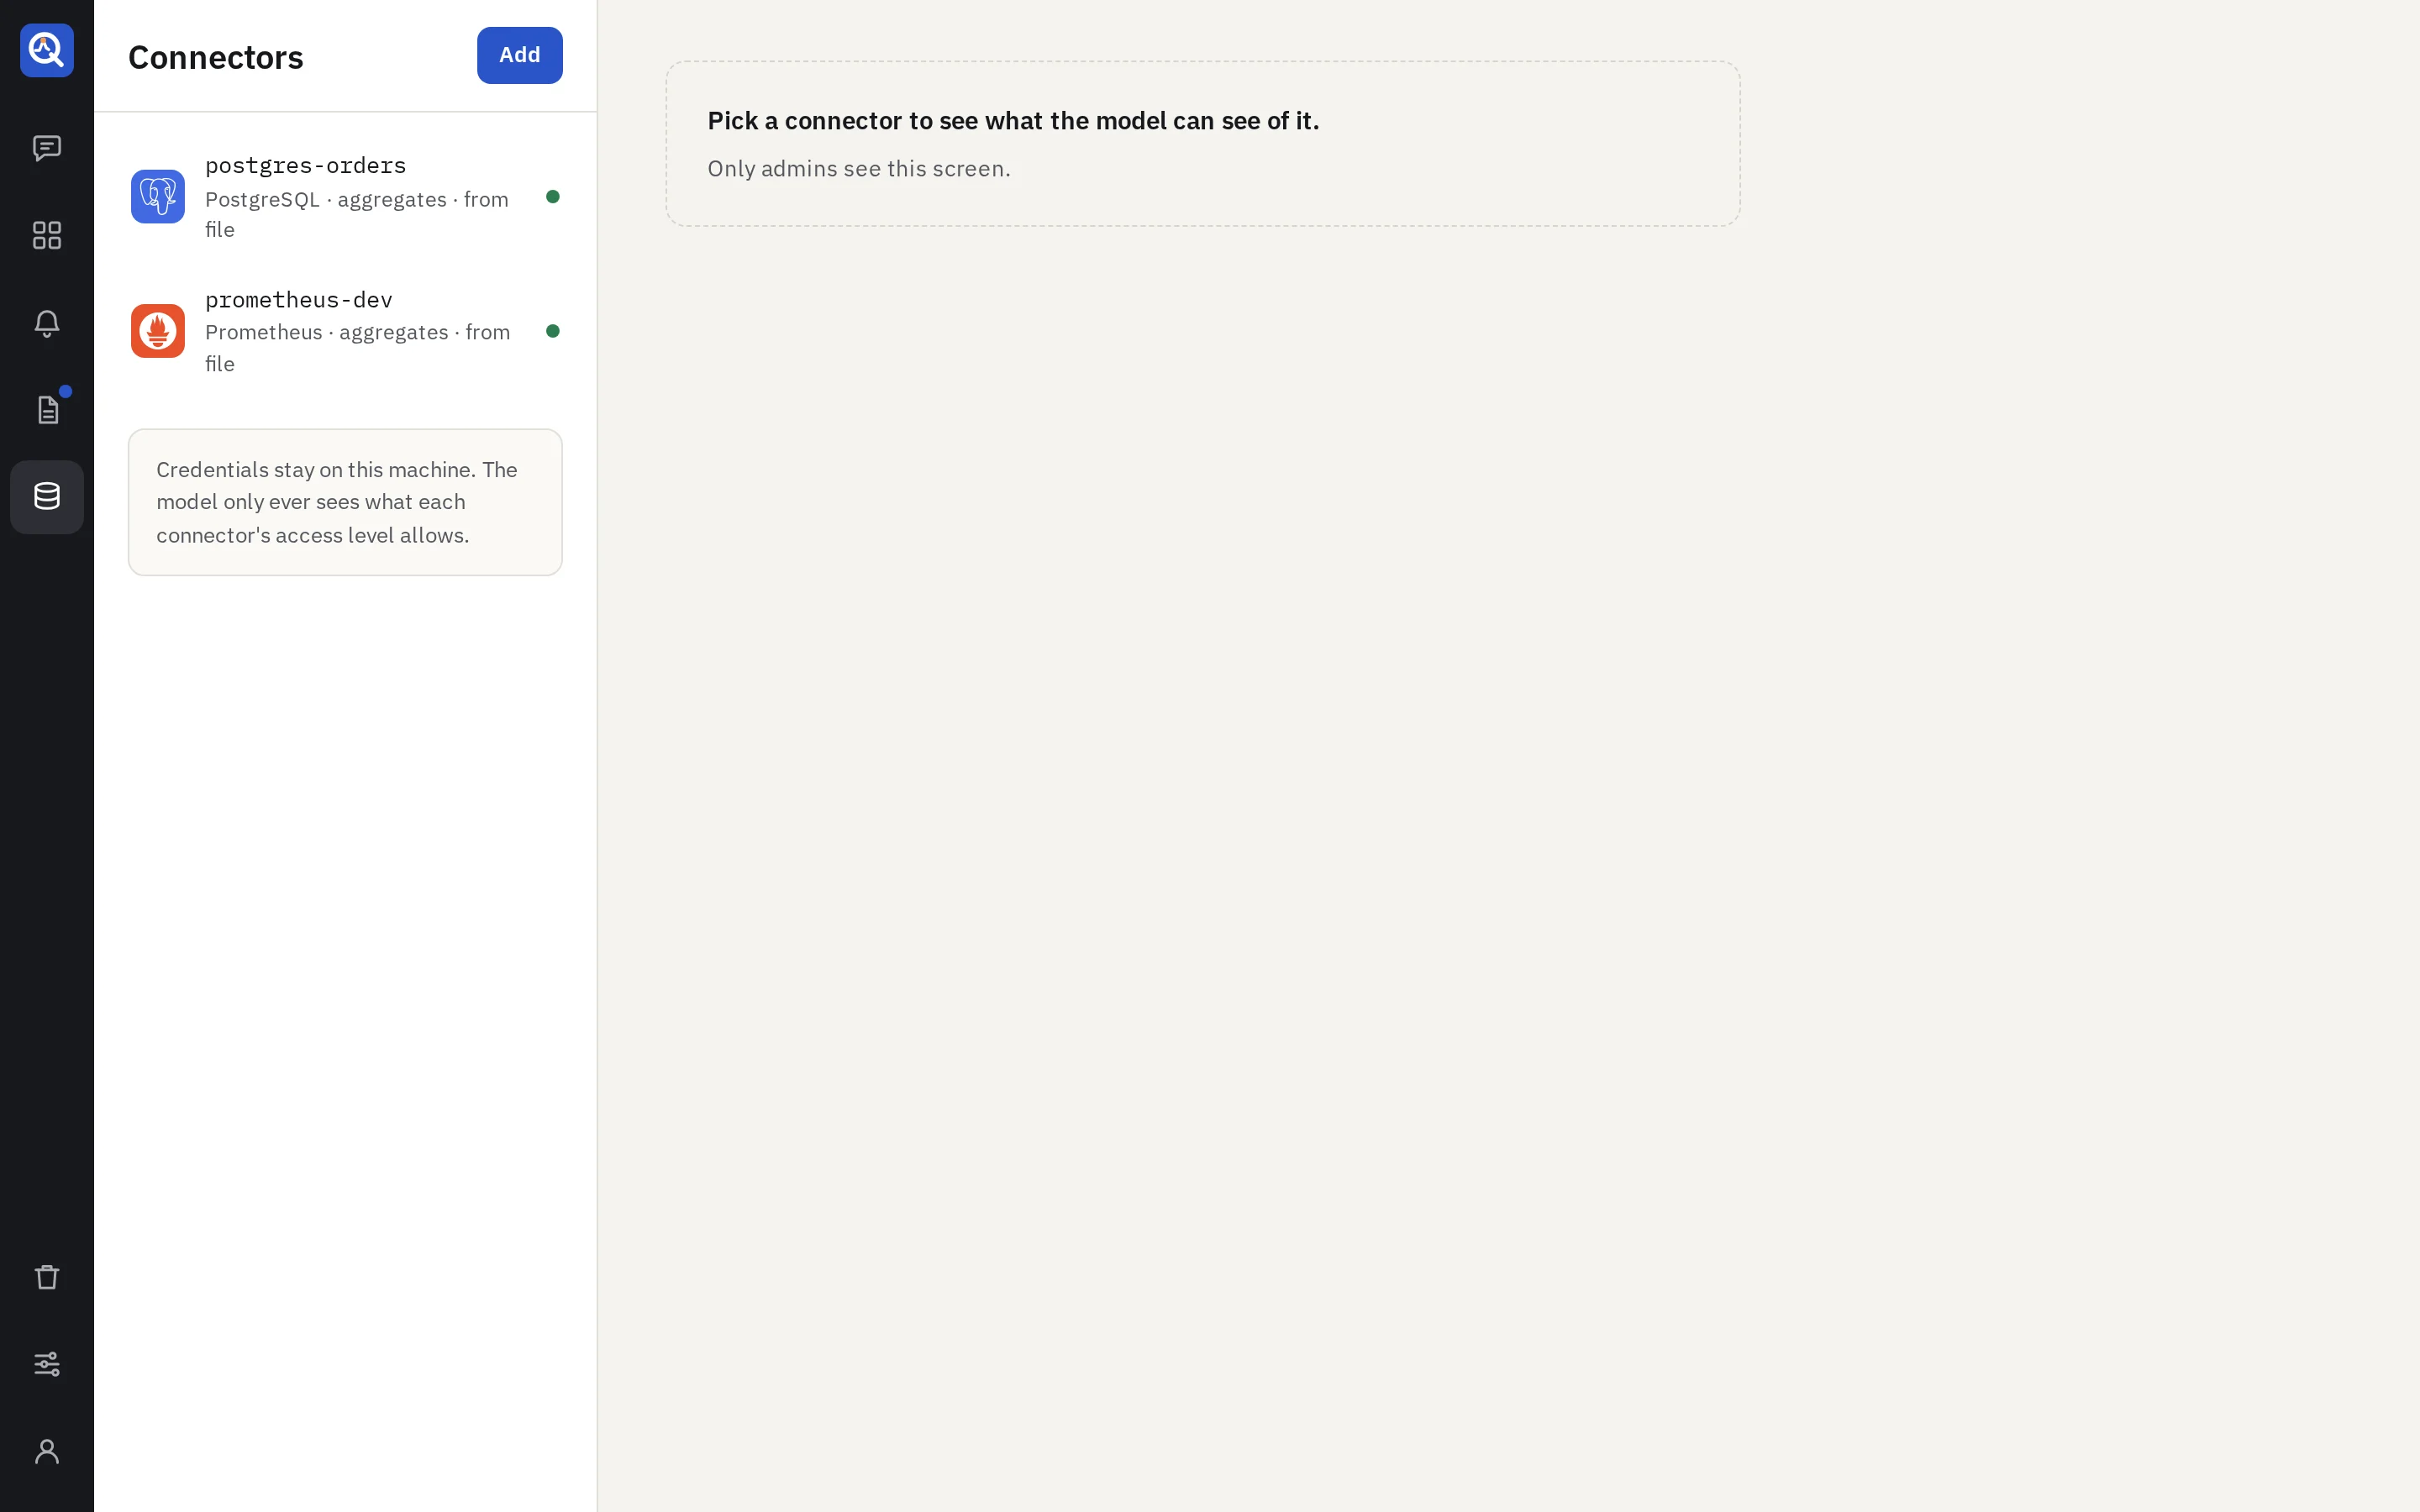
Add a connector
- Connectors → Add a connector, and pick the kind. Plugins add more kinds; see Connectors and plugins.
- Name it: lowercase letters, digits and dashes. Dashboards refer to the connector by this name.
- Fill in the connection. The credentials are sealed with quanthea’s secret key and never shown again.
- Save connection. quanthea tests it and reads the schema.
Give quanthea a read-only account. Queries always run read-only, and each kind refuses what isn’t a read (writes in SQL, scripts in a search, JavaScript in MongoDB, write commands in Valkey), but a role with read grants only is the hard guarantee. quanthea warns when a connection can write.
Access levels
The access level decides what the model sees of the source while it builds, answers and explains. It never limits what a dashboard shows: panels run their saved queries with no model.
| Level | The model sees |
|---|---|
| Schema only | Tables, columns, types. Nothing else. |
| Schema + metadata | Also row counts, the values of small columns, and the shape of a test run. |
| Aggregates | Also summaries of results: min, max, spikes, top values, and when. |
| Full access | Also result rows, capped at the row limit. |
Schema + metadata is the default. It is enough to build dashboards. Ask about this reads numbers only from sources at Aggregates or Full access; below that, answers can only explain. Alert replays in a conversation need Aggregates too.
Each thread shows the access of its sources under the question box.
A connector’s page
Hidden columns
Never show these columns, at any level: list columns such as customers.email, or a bare name
such as phone. They are removed from the schema and from every result before the model sees it.
A query that renames a column gets past the name, so for data that must never leave, use a database role or a view that cannot read it.
Guardrails
| Guardrail | Default | What it does |
|---|---|---|
| Query timeout (seconds) | 10 | A query stops after this long. |
| Max rows per query | 50,000 | A result is cut at this many rows. |
| Max time range (days) | 90 | A panel can’t ask for a longer range. |
They apply to everything that runs a query: panels, alerts, report runs, snapshots and the model.
The schema and descriptions
The page lists the tables or metrics the model sees, as it sees them at this level. Write a description for a table or a column when its name doesn’t say enough: the model reads yours in place of the source’s.
Health
The list shows each connector’s last test. A failing source shows on its panels as a safe error, and alerts on it say they cannot be checked.
In the configuration file
Connectors can be declared in the configuration file, with their credentials as references to environment variables or files. Their settings are then read-only here; descriptions stay editable unless the file declares them. See the configuration file.