


Data sources
A connector is one data source quanthea reads: a PostgreSQL database, a Prometheus server, a Loki instance, an HTTP API. Admins add and tune them in Connectors. Each connector says how much of its data the model may see, which columns it never sees, and how far a query may go.
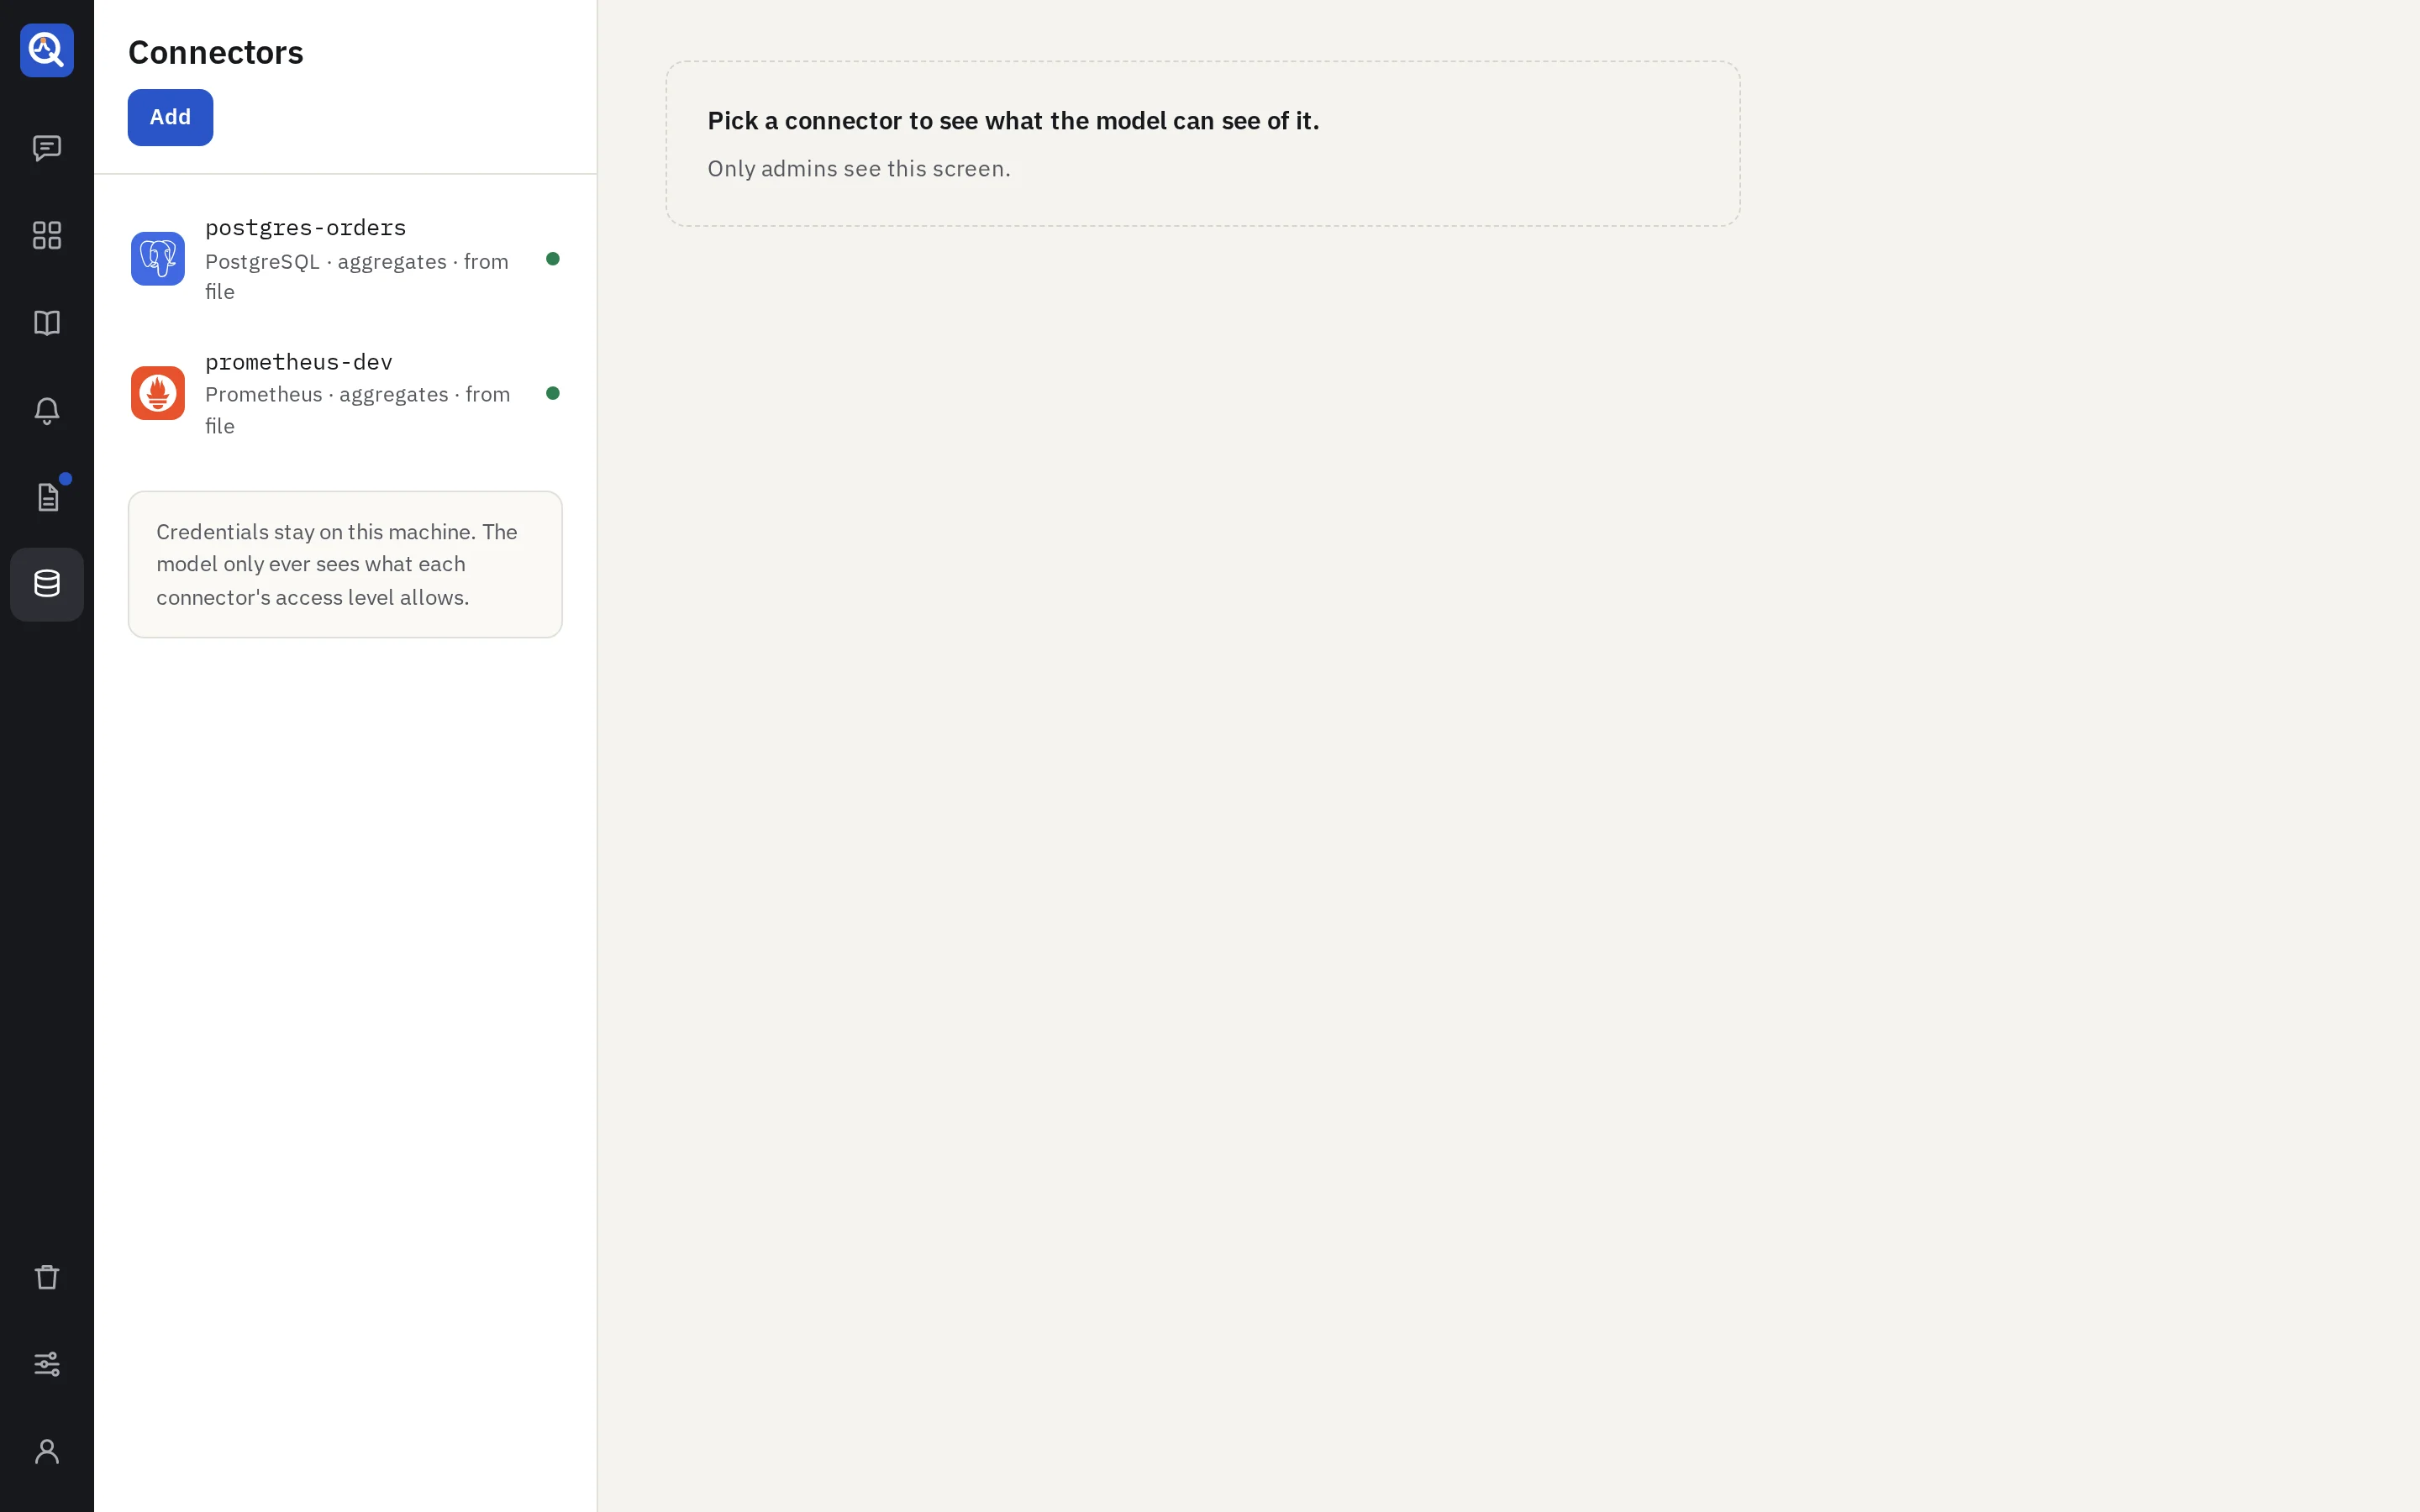
Add a connector
- Connectors → Add a connector, and pick the kind. Plugins add more kinds; see Connectors and plugins.
- Name it: lowercase letters, digits and dashes. Dashboards refer to the connector by this name.
- Fill in the connection. The credentials are sealed with quanthea’s secret key and never shown again. A URL or a host must not hold a username or password: use the authentication fields.
- Save connection. quanthea tests it and reads the schema.
Give quanthea a read-only account. Queries always run read-only, and each kind refuses what isn’t a read (writes in SQL, scripts in a search, JavaScript in MongoDB, write commands in Valkey), but a role with read grants only is the hard guarantee. quanthea never refuses a connector whose credentials can write: it warns, and says what to do. See What a connection can reach and Credentials that can write.
TimescaleDB
TimescaleDB is a PostgreSQL extension, so quanthea reads it with the PostgreSQL connector: its tile says “and TimescaleDB”, and searching for “timescale” finds it.
- The connection test names the extension’s version, such as “PostgreSQL 18.1 with TimescaleDB 2.30”.
- The schema lists hypertables, each with its time column and estimated row count, and continuous aggregates, each with the hypertable it summarises. Row counts come from TimescaleDB’s chunk statistics, not from reading the data.
- The agent buckets time with
time_bucketand fills empty buckets withtime_bucket_gapfill. Over a long range it reads a continuous aggregate rather than its hypertable, since it is already bucketed.
Access levels
The access level decides what the model sees of the source while it builds, answers and explains. It never limits what a dashboard shows: panels run their saved queries with no model.
| Level | The model sees |
|---|---|
| Schema only | Tables, columns, types. Nothing else. |
| Schema + metadata | Also row counts, the values of small columns, and the shape of a test run. |
| Aggregates | Also summaries of results: min, max, spikes, top values, and when. |
| Full access | Also result rows, capped at the row limit. |
Schema + metadata is the default. It is enough to build dashboards. Ask about this reads numbers only from sources at Aggregates or Full access; below that, answers can only explain. Alert replays in a conversation need Aggregates too.
Each thread shows the access of its sources under the question box.
A connector’s page
Hidden columns
Hide these columns from the model, by name: list columns such as customers.email, or a bare
name such as phone. They are removed from the schema and from every result before the model sees
it. Names match in any case. A hidden object, such as logs.user, hides every field under it.
A field that holds a hidden one is removed whole: hiding logs.user.email also removes a user
column that holds an array of user objects, and the schema marks user as holding a hidden field.
A column that ends with a hidden name, such as c.email, is removed too.
Add column suggests the columns of the schema while you type. A name the schema does not have is marked not in the schema and still hidden: the column may come later, or only in a query’s result.
A query that renames a column gets past the name: its top values show at the aggregates level, its rows at full access. For data that must never leave, use a database role or a view that cannot read it.
Restricting access later
Lowering the access level or hiding a column applies to new tool calls. Data the model already read stays in its threads, and continuing a thread sends its conversation, that data included, to the model provider again.
Before such a change is saved, the page counts the threads that hold data it restricts and asks you to confirm. If the count fails, the page says why and still lets you save or cancel. Those threads are then marked Restricted data in the past threads list, and each shows a notice above the question box. Start a new thread to leave that data out.
The count and the mark follow the model’s tool calls. The model also gets a short list of field values with each question, read at the access in force then. An earlier answer that quoted one of those values, with no tool call, is not counted or marked.
What a connector shows
A connector shows the model, and lets queries read, what the source’s credentials can read, with
two limits you set. They are in the section What the connector shows of the connector’s page,
in the configuration file and in the API, as visibility.
- System objects are hidden. They are the source’s own: on Elasticsearch and OpenSearch the
indices whose name starts with a dot and the security audit, query insight and lifecycle history
indices; on a SQL source
information_schemaand the server’s catalogs (pg_catalog,performance_schema,mysql,sys,system); on MongoDB thesystem.collections. SetshowSystemto show them. - A list of names. With
mode: exceptthe names are hidden; withmode: onlynothing else is shown. A name is one the schema lists, or a pattern such aslogs-*, where*stands for any text. - Case counts where the source says so. MongoDB collections, Redis keys, Prometheus metrics
and HTTP endpoints are told apart by case, so their names match as written:
ordersdoes not coverOrders, and an endpoint isGET /users, with the method in capitals. Names of SQL tables, of Elasticsearch and OpenSearch indices and of Loki match in any case. - On a SQL source a hidden name hides the table in every schema.
salarieshideshr.salariesandpublic.salaries, in the catalogue as in a query. To hide one of them only, write it with its schema. Withmode: only, a name shows the table written as the schema lists it.
On the connector’s page:
- Show system objects is the switch for the first limit. It is there for SQL sources, Elasticsearch, OpenSearch and MongoDB.
- All but these and Only these say how the list reads. Each keeps its own list while you edit, so switching back loses nothing.
- The checklist holds what the schema found, with a line that counts what is shown. A tick means shown. Tick all and Clear all act on the names the filter keeps.
- Name or pattern adds an entry such as
logs-*, suggests the schema’s names while you type, and says how many objects the entry covers. Patterns and names the schema lacks show as chips with that count. A name the schema lacks is marked not in the schema and kept: the object may come later. - A checkbox is greyed out while the switch or another entry decides for its object: a pattern, or on a SQL source a hidden name that covers the table in every schema. Remove that entry to tick or clear one name under it.
- With Only these and nothing ticked or listed, the connector shows nothing.
- A list holds at most 500 names and patterns. Use a pattern for the rest.
- Save what it shows saves the whole section. Reset puts back what is saved.
Before saving, the page counts the threads and the pinned dashboards that read an object the change hides, and asks you to confirm when there are any. The count covers the latest version of each thread’s dashboard and the pinned version of each pinned dashboard. It leaves out threads in the bin, alerts and reports. If the count fails, the page says why and still lets you save or cancel.
The schema panel on the right strikes through what the connector does not show.
A hidden object is left out of what the model reads, and every query on it is refused with a message that names it: a panel, a variable, a marker, a saved query, an alert, a report and a question in Ask about this. A dashboard that names one cannot be saved. A pinned dashboard that reads an object you hide later shows the refusal on its panels.
How sure the refusal is depends on the source:
| Source | What is checked | How sure |
|---|---|---|
| Elasticsearch, OpenSearch | The server resolves the index names and patterns first. | Exact: * reaches only what is shown, aliases and data streams included. |
| MongoDB | The collection, and the ones a pipeline joins or appends. | Exact for collections. A view reads what its definition says. |
| Redis, Valkey | The key a command reads. | Exact. |
| HTTP | The method and path of the request. A redirect to a path the connection does not allow. A . or .. between encoded slashes (%2F) or before a ;. | Exact for the request. {id} in a name stands for any text, so the allowed paths of the connection stay the limit. |
| Prometheus | The metric names of the expression. | Exact. A selector that names no metric is refused once you list names. |
| Loki | The one object, logs. | All or nothing. Restrict streams with the credentials. |
| SQL sources | The table names after FROM and JOIN. | Best effort: a view, a function or the search path can reach a table the query never names. |
For SQL, treat the list as a way to keep the model on the right tables, not as a lock. For data that must never leave, use a database role that cannot read it.
On Elasticsearch and OpenSearch the credentials must be allowed to resolve index names
(view_index_metadata, or indices:admin/resolve/index). Searches fail with the server’s refusal
otherwise.
A SQL or MongoDB schema never lists system objects. showSystem lets queries read them there.
A connector made before this setting existed keeps Show system objects on after the upgrade,
so its dashboards, alerts and reports run as before. Turn it off when nothing reads a system
object. A connector declared in the configuration file follows the file, where showSystem is
off unless you write it.
Guardrails
| Guardrail | Default | What it does |
|---|---|---|
| Query timeout (seconds) | 10 | A query stops after this long. |
| Max rows per query | 50,000 | A result is cut at this many rows. |
| Max time range (days) | 90 | A panel can’t ask for a longer range. |
They apply to everything that runs a query: panels, alerts, report runs, snapshots and the model. The page lists them under Limits you set. The access level is the other setting that bounds what a query gives.
Always enforced
Under the limits, the page lists the rules of the connector’s query language. They are rules, not settings: turning one off would run text a model wrote on the documents of the data source. One rule of a search follows a setting, bucket scripts.
| Query language | What is always refused |
|---|---|
| SQL | A second statement. A statement that does not start with SELECT, WITH, VALUES or TABLE, or that holds a keyword that writes or changes the schema. A value as SQL text: variables are parameters. A function that reads or writes the server’s files, reaches another server, runs a program or runs text as SQL, such as pg_read_file, dblink, LOAD_FILE, url() or a Trino system.query. |
| PromQL | Anything but an expression sent to the query endpoints. A variable outside a quoted label matcher value, except an interval where a duration goes. |
| LogQL | Anything but an expression sent to the query endpoints. A variable outside a quoted value, except an interval where a duration goes. The formatting templates line_format and label_format, which the source runs. |
| Search (Elasticsearch, OpenSearch) | Scripts that read documents: script_fields, scripted_metric, script queries, sorts and scores, scripted terms, stored scripts and any other script key. Runtime fields. Lookups of another index: a terms lookup, an indexed shape, a percolator, a document list that names an _index. Wrapper queries. Remote indices and _ names. An index name with a slash, a %, a ?, or of dots alone. |
| HTTP | Another origin, a redirect to one, and cloud metadata addresses. A method or a path the connection does not allow. A path with a . or .. segment (also before a ;), an empty segment, ?, # or a backslash. A variable in a header. |
| Redis (Valkey) | Any command outside the fixed list of reads: nothing writes, scans every key or runs a script. |
| MongoDB | $out and $merge. JavaScript: $where, $function, $accumulator. Stages that wait for changes or read the server’s operations, sessions, queries, plans, catalog or statistics. Another database. |
Bucket scripts
An Elasticsearch or OpenSearch connector has one more setting under the limits: Allow a script
in bucket_script and bucket_selector. It is off on every connector until an admin switches it
on, in the page or with bucketScripts: true in the
configuration file.
| Setting | What a search may run |
|---|---|
| Off | The two fixed ratio scripts of a bucket_script: a share, and one minus it. |
| On | Also one expression of the query’s own in a bucket_script or a bucket_selector, such as a difference of two counts, or keeping only the buckets above a number. |
A query the agent writes is a query like any other: with the setting on, the agent may write such an expression. With it off, the agent keeps to the ratio scripts, and tells you an admin can allow more when a question needs it.
Every other script stays refused, whatever the setting: script_fields, runtime fields,
scripted_metric, script queries, sorts and scores, scripted terms and stored scripts. A script
in those places reads documents, so it would go around hidden fields and access levels. A script
in the two bucket aggregations receives only the numbers of the buckets it names.
An allowed script keeps these limits:
- It is written in the query, as text or as
{"source": …, "params": {…}}. A stored script and a language other than Painless are refused. - The aggregation names its buckets in
buckets_path, written out: a variable there is refused. - It is one arithmetic expression of at most 300 characters: numbers,
params.name,+ - * / %, comparisons,&& || !,? :, parentheses and a fewMathfunctions. A statement, a loop, a string or another call is refused, because a script that loops or allocates can exhaust the search server’s memory. An operator stands between two values, so++,--, a shift, a regex and a comment are refused too. - A value that changes goes in
params, never in the text. The search server compiles each distinct text and limits how many it compiles in a few minutes. A dashboard variable goes there as{"min": {"$var": "threshold"}}and arrives as text, whichDouble.parseDouble(params.min)reads.
{
  "_errors": { "filter": { "term": { "level": "error" } } },
  "_warnings": { "filter": { "term": { "level": "warn" } } },
  "more": {
    "bucket_script": {
      "buckets_path": { "errors": "_errors>_count", "warnings": "_warnings>_count" },
      "script": "params.errors - params.warnings"
    }
  },
  "_busy": {
    "bucket_selector": {
      "buckets_path": { "count": "_count" },
      "script": { "source": "params.count > params.min", "params": { "min": 100 } }
    }
  }
}
Switching the setting off again refuses the dashboards, alerts and reports whose queries hold such a script, from their next run. They show the refusal until the setting is on again or the query changes.
The schema and descriptions
The page lists the tables or metrics the model sees, as it sees them at this level. Write a description for a table or a column when its name doesn’t say enough: the model reads yours in place of the source’s.
Health
The list shows each connector’s last test. A failing source shows on its panels as a safe error, and alerts on it say they cannot be checked.
What a connection can reach
The model writes a query. It never names an endpoint of the source or an HTTP method: the connector’s code does, and the list is fixed for each kind. The HTTP JSON kind is the one exception, and there you set the methods and the paths.
| Kind | What quanthea sends | What a query sets |
|---|---|---|
| PostgreSQL, TimescaleDB | One statement per query, over the protocol that takes one statement, in a read only transaction with a statement timeout. The transaction reads strings as the standard does, whatever the role sets. | The text of one read statement. Values are bound. |
| MySQL, MariaDB | One prepared statement per query, in a session set READ ONLY, with several statements and local files turned off in the driver, and the session’s sql_mode pinned so quotes read one way. | The text of one read statement. Values are bound. |
| ClickHouse | A POST to the HTTP interface with the statement as its body and readonly=1 on it, or the user’s own readonly=2. | The text of one read statement, without SETTINGS or FORMAT. Values are bound. |
| Trino | A POST to /v1/statement, GETs of that query’s pages, and a DELETE of its own next page to cancel it. Each query runs in START TRANSACTION READ ONLY, rolled back after it. | The text of one read statement. Values are literals in EXECUTE IMMEDIATE … USING. |
| InfluxDB 3 | A POST to /api/v3/query_sql, which runs no write, and a GET of /ping. | The text of one read statement. Values are named parameters. |
| Prometheus | GETs only: /api/v1/query, /api/v1/query_range, the label and metadata lists, and the build and flags of /api/v1/status. | The expression and its step. |
| Loki | GETs only: /loki/api/v1/query, /loki/api/v1/query_range, the label and detected field lists, the index statistics and the build. | The expression and its step. |
| Elasticsearch, OpenSearch | For a query, POST /<index>/_search. For the schema and the test, GETs of /, /_mapping, /<index>/_mapping, /_cat/indices, /_alias, /_resolve/index/<names> and what the signed-in user may do (/_security/user/_privileges, or /_plugins/_security/authinfo). Nothing else. | The index names and the search body, without scripts. |
| Valkey | One command per query, from a fixed list of reads. For the schema and the test: HELLO, ACL WHOAMI, ACL DRYRUN (which runs nothing), SCAN, TYPE and reads of a few keys. | The command, from that list, and its arguments. |
| MongoDB | One aggregate per query, on one collection of the connector’s database. For the schema and the test: buildInfo, connectionStatus, listCollections, a document count estimate and small samples. | The collection and the pipeline, without stages that write or run JavaScript. |
| HTTP JSON | The request a query describes, to the base URL’s origin only, with the method and the path checked against the connection’s settings. A redirect is followed only within the origin and the allowed paths. | The method (GET, or POST if you allow it), the path, the parameters and a JSON body. |
What a query may hold is under Always enforced. Two things are worth knowing about those rules.
- They refuse what is known. In SQL the server’s own read-only session stops a write, and
quanthea refuses by name the functions that reach past the tables, such as
pg_read_file,dblink,LOAD_FILEor ClickHouse’surl(). A function your database adds, such as aSECURITY DEFINERfunction or an extension’s, is not on that list. - A source without a read-only session has only the rules: InfluxDB, a search server, Valkey, MongoDB, an HTTP API.
So an account that can only read is the guarantee, whatever the kind.
Credentials that can write
The connection test asks the source what the connector’s credentials may do. It only reads to find out: it never tries a write. When they can do more than read, the connector’s page says so at the top, large and plain:
These credentials can write. You may want to look at that.
Under it the page lists what the test found, such as “It can insert, update or delete in 12 tables”, and the account to create, as statements to copy. The warning is advice. quanthea never refuses the connector, never blocks saving it, and runs its queries as before. A connector declared in the configuration file gets the same warning on its page.
When the source cannot say, the page says the test could not tell. It never calls credentials read-only on a guess.
| Kind | What the test reads | It says “can write” for | It cannot tell when |
|---|---|---|---|
| PostgreSQL, TimescaleDB | The catalog: the role, and its privileges however it holds them (granted, inherited, given to everyone, as the owner). | A superuser. A table it can insert into, update, delete from or truncate, by a grant on the table or on some columns. A sequence it can set. CREATE on a schema or the database. The server’s write and file roles. CREATEROLE, CREATEDB. | Never. |
| MySQL, MariaDB | information_schema: the privileges granted to the user on the server, a schema, a table or some columns. | INSERT, UPDATE, DELETE, CREATE, DROP, ALTER, INDEX, TRIGGER, EVENT, FILE, SUPER, CREATE USER, RELOAD, SHUTDOWN and the routine and view privileges. | The user has an active role: a role’s grants are not listed there. |
| ClickHouse | The user’s readonly setting and SHOW GRANTS FINAL. | A grant that inserts, alters, creates, drops, truncates, optimizes, or manages the server or its users, unless the user has readonly=2. | Never. |
| Elasticsearch | The user’s own privileges, GET /_security/user/_privileges. | A cluster privilege beyond monitor and read_*. An index privilege beyond read, view_index_metadata and monitor. Acting as another user. A server with security off. | The server refuses the question. |
| OpenSearch | The user’s roles, GET /_plugins/_security/authinfo. | The role all_access. A server without the security plugin. | The user holds any role but readall and readall_and_monitor: the plugin names roles, not what they allow. |
| Valkey | ACL DRYRUN for a write of each data type (SET, DEL, EXPIRE, HSET, LPUSH, SADD, ZADD, XADD), PUBLISH, FLUSHALL, EVAL and CONFIG SET, tried on a key the user reads. A dry run checks the user’s rights and runs nothing. | Any of them allowed. | The user may not run ACL DRYRUN, or it reaches some keys only and the test found none of them to try. |
| MongoDB | The privileges connectionStatus lists. | An action that inserts, updates, removes, creates, drops, empties or reconfigures, in the connector’s database or another, or that manages users. A server that asks for no sign-in. | No user signed in and the server refuses to list collections. A user with an action the test knows neither as a read nor as a write. |
| InfluxDB 3 | The server’s edition, and whether the connector sends a token. | A server that asks for no token. Any token of InfluxDB 3 Core, which has admin tokens only. | Another edition, whose tokens can be limited to reading without the server saying so. |
| Prometheus | The server’s flags, GET /api/v1/status/flags. Prometheus has no users: an API that is on is on for every request. | The admin API, the lifecycle API, or a remote write or OTLP receiver turned on, by its flag or by --enable-feature. | The server lists no flags, or not those of Prometheus, as one that only speaks the Prometheus query API does. |
| Trino, Loki, HTTP JSON | Nothing about writing. | Never. | Always: access is set in files, in a proxy or in the API, where the test cannot read it. |
A read-only account, per kind
Change the names, the password and what the account reads to fit. The connector’s page gives the same statements with your database’s name filled in.
PostgreSQL and TimescaleDB
CREATE ROLE quanthea_read LOGIN PASSWORD 'choose-a-password';
GRANT CONNECT ON DATABASE "orders" TO quanthea_read;
GRANT USAGE ON SCHEMA public TO quanthea_read;
GRANT SELECT ON ALL TABLES IN SCHEMA public TO quanthea_read;
ALTER DEFAULT PRIVILEGES IN SCHEMA public GRANT SELECT ON TABLES TO quanthea_read;
ALTER ROLE quanthea_read SET default_transaction_read_only = on;
-- PostgreSQL 14 and earlier, and a database upgraded from one, let every role create tables in
-- public. This takes that from all of them: grant it again to the roles that need it.
REVOKE CREATE ON SCHEMA public FROM PUBLIC;
Without the last statement the test still says “It can create tables in public” on a database
where every role may: the right comes from PUBLIC, not from a grant to the role.
MySQL and MariaDB
CREATE USER 'quanthea_read'@'%' IDENTIFIED BY 'choose-a-password';
GRANT SELECT ON `orders`.* TO 'quanthea_read'@'%';
ClickHouse
CREATE USER quanthea_read IDENTIFIED BY 'choose-a-password' SETTINGS readonly = 2;
GRANT SELECT ON `orders`.* TO quanthea_read;
Use readonly = 2, not readonly = 1: the connector sets a row cap and a timeout on each
query, and readonly = 1 refuses every setting.
Elasticsearch
POST /_security/role/quanthea_read
{
  "cluster": ["monitor"],
  "indices": [
    { "names": ["logs-*"], "privileges": ["read", "view_index_metadata", "monitor"] }
  ]
}

POST /_security/user/quanthea_read
{ "password": "choose-a-password", "roles": ["quanthea_read"] }
OpenSearch
PUT /_plugins/_security/api/internalusers/quanthea_read
{ "password": "choose-a-password", "opendistro_security_roles": ["readall"] }
The role is given on the user, so the mapping of readall stays as it is. Do not PUT the role’s
mapping (rolesmapping/readall) to add the user: that replaces the mapping and takes the role from
everyone who had it. readall reads every index. A role of your own that reads fewer is as safe, but the test cannot
read what it allows, so the page then says it could not tell.
Valkey
ACL SETUSER quanthea_read on >choose-a-password ~* +@read -@dangerous +info +acl|whoami +acl|dryrun+acl|whoami and +acl|dryrun let the test ask what the user may run. Without them the page says
it could not tell.
MongoDB, in mongosh
db.getSiblingDB("shop").createUser({
  user: "quanthea_read",
  pwd: "choose-a-password",
  roles: [{ role: "read", db: "shop" }]
})
InfluxDB 3
InfluxDB 3 Core has admin tokens only, so no token of it is read-only. InfluxDB 3 Enterprise makes one:
influxdb3 create token --permission "db:telemetry:read" --name quanthea_readPrometheus
Start it without --web.enable-admin-api, --web.enable-lifecycle,
--web.enable-remote-write-receiver and --web.enable-otlp-receiver, or put a proxy in front
that passes only GETs of /api/v1/.
Trino, Loki and HTTP JSON
- Trino: give the connector’s user read-only rules in the access control file, or a catalog whose own credentials only read.
- Loki: Loki has no users. Put a proxy in front that passes only GETs of
/loki/api/v1/, so the push endpoint cannot be reached. - HTTP JSON: use a key or a token the API limits to reading, allow GET only, and list the paths.
In the configuration file
Connectors can be declared in the configuration file, with their credentials as references to environment variables or files. Their settings are then read-only here; descriptions stay editable unless the file declares them. See the configuration file.