


Ask about this, and Explain
A pinned dashboard answers questions about what it shows, and explains how each panel is computed. Both use the model, and both keep what they wrote, so the next person reads it for free.
Analysts and above ask and have panels explained. Viewers read every question, answer and explanation.
Ask about this
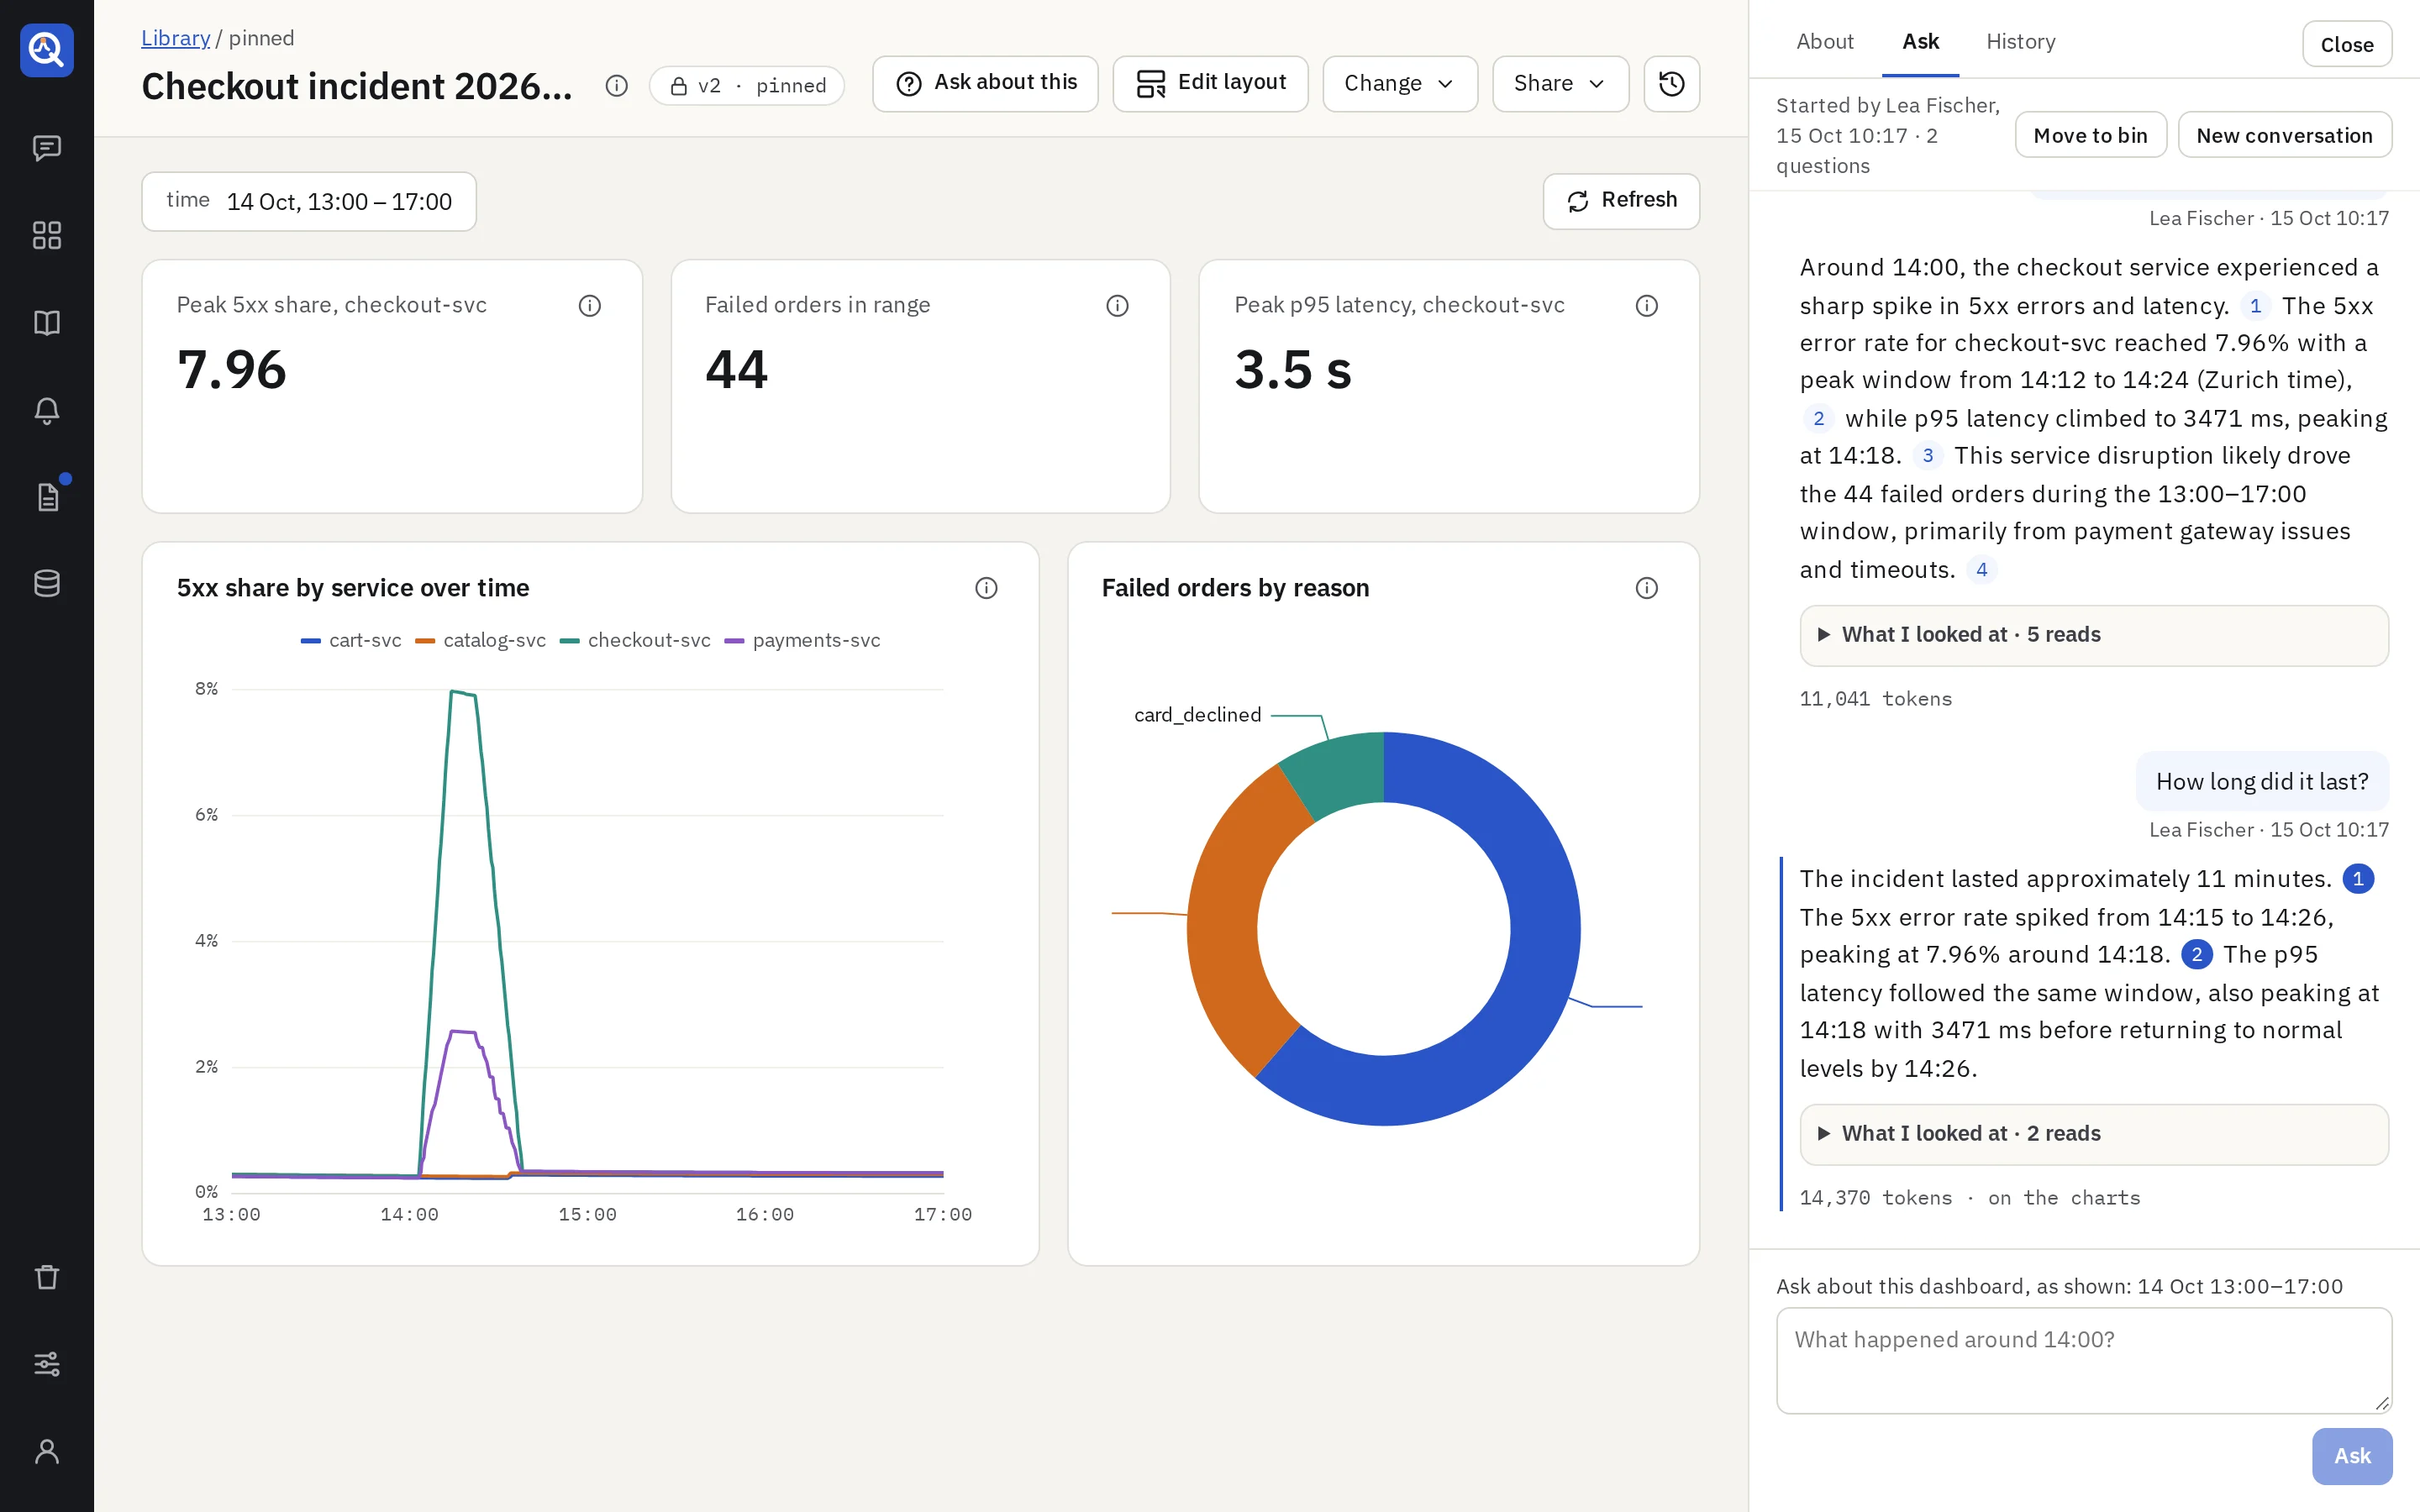
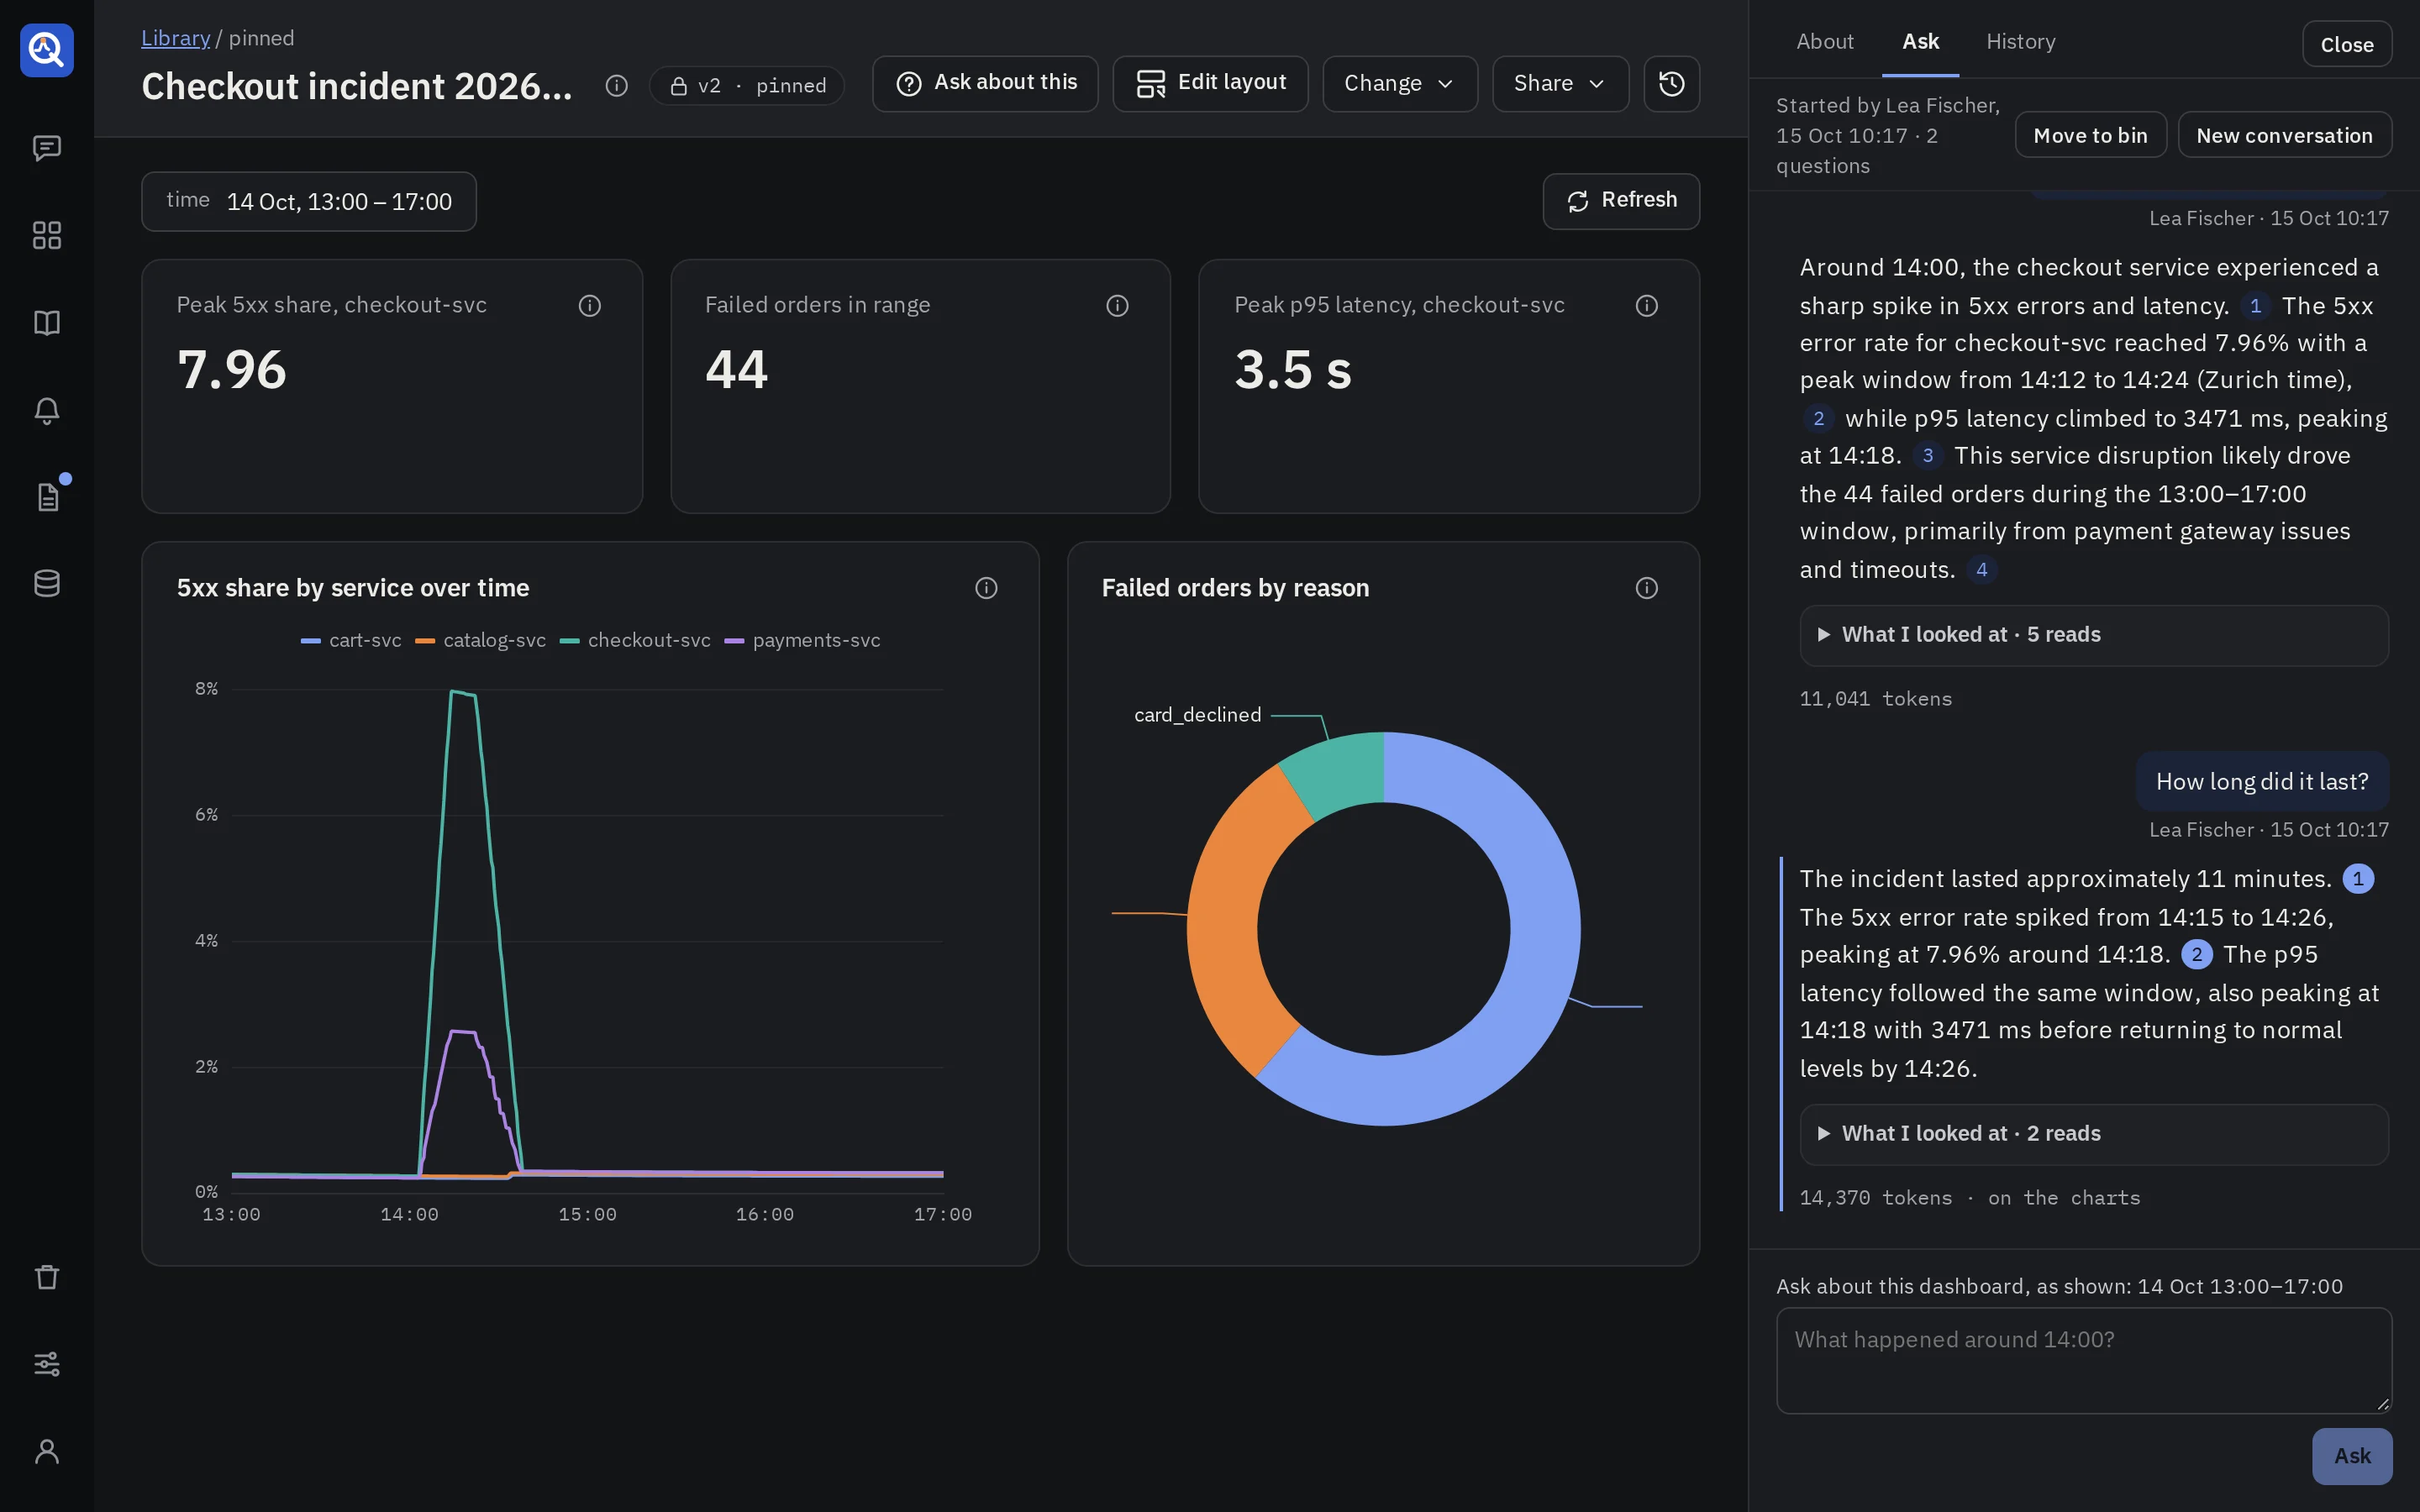
On a pinned dashboard, Ask about this opens a side panel with three tabs: About, Ask and History.
Asking
Type a question, such as “What happened around 14:00?”. The box’s label says what the question is about: the time range you look at, in absolute times, and the variable values, as shown.
- The answer streams in. Every number in it carries a citation, such as [1].
- Each cited panel gets the citation’s number in its header, and the cited time window is shaded on its chart.
- The citation numbers of the other answers are grey. Click an answer to mark the dashboard with its citations instead.
- What I looked at lists each read the model made: the panel or its own query, the source, and a short summary of what it saw.
- Follow-up questions continue the same conversation: “How long did it last?”. When you change the time range or a variable in between, a line says what the next question is about.
- New conversation starts over.
The model answers from the evidence it read, and says what it could not see. quanthea checks every answer before you see it: each citation must point at a read that happened or a panel of the dashboard, within the range you asked about. An answer that fails the check is repaired once, or the question fails cleanly; you never get an unchecked answer.
When the model stops without answering, quanthea asks it once more to answer from what it has already read. If no answer comes, the message says why: the model’s output was cut at its limit, it wrote a call that could not be read, its provider withheld the response, it stopped with nothing, or the limits of one answer were reached. When the tool calls or the tokens of one answer were used up first, the message says so. The provider’s own reason for the ending is not in the message: it is in the server’s log, for an admin.
Time of day and day of the week
Ask “When do we have the most traffic during the day, and is it consistent?” and the model reads the measure hour by hour over several days. From such a read it gets, beside the lowest, highest and mean values, a profile on the dashboard’s clock:
- each hour of the day, with its mean over the days and its lowest and highest day;
- which hour was the highest of its day, and on how many of the days (a measure that never moves has no highest hour);
- each day of the week, when the read covers two weeks or more.
So the answer says which hours are busy and how steady that is, from numbers it read, not from arithmetic of its own.
- The hours need points an hour apart or closer, over three days or more. The days of the week need points a day apart or closer, over two weeks or more.
- When the range you look at is shorter, the model may read a longer one for the profile.
- When the source holds fewer days than that, there is no profile, and the answer says the data is too short to call a pattern.
The profile is part of a summary, so it follows the source’s access level like the other aggregates.
What the model may read
Answers read data only from sources at the Aggregates or Full access level. At a lower level, a note says the answer can only explain, lists the sources with their levels, and says an admin can raise one in Connectors. See Data sources.
The model reads through the same guardrails as the dashboard: your variable values are bound, never pasted into a query, and nothing it runs writes.
Already answered
While you type, the panel looks up earlier questions that share your words, and shows up to three above the box (“Asked on 26 Sep by Ana: …”). Opening one shows its conversation and highlights the answer. No model runs for that.
History
History lists the dashboard’s conversations, grouped by day: the first question, who started it, how many questions it holds and when the latest was asked. Its search finds the conversations whose questions and answers hold every word. Analysts and above continue any of them.
Whoever started a conversation, and admins, may move it to the bin.
Ask about a report’s run
A report’s run has the same panel. The model reads the results the run froze, and can read the source again on the run’s period for detail. Its answers may end with Worth watching: up to three suggested alerts or dashboards, each one click from a new thread with its request filled in.
Explain a panel
On a pinned version, a panel’s info bubble opens on its explanation: what the panel measures, how its query computes it, and why that choice.
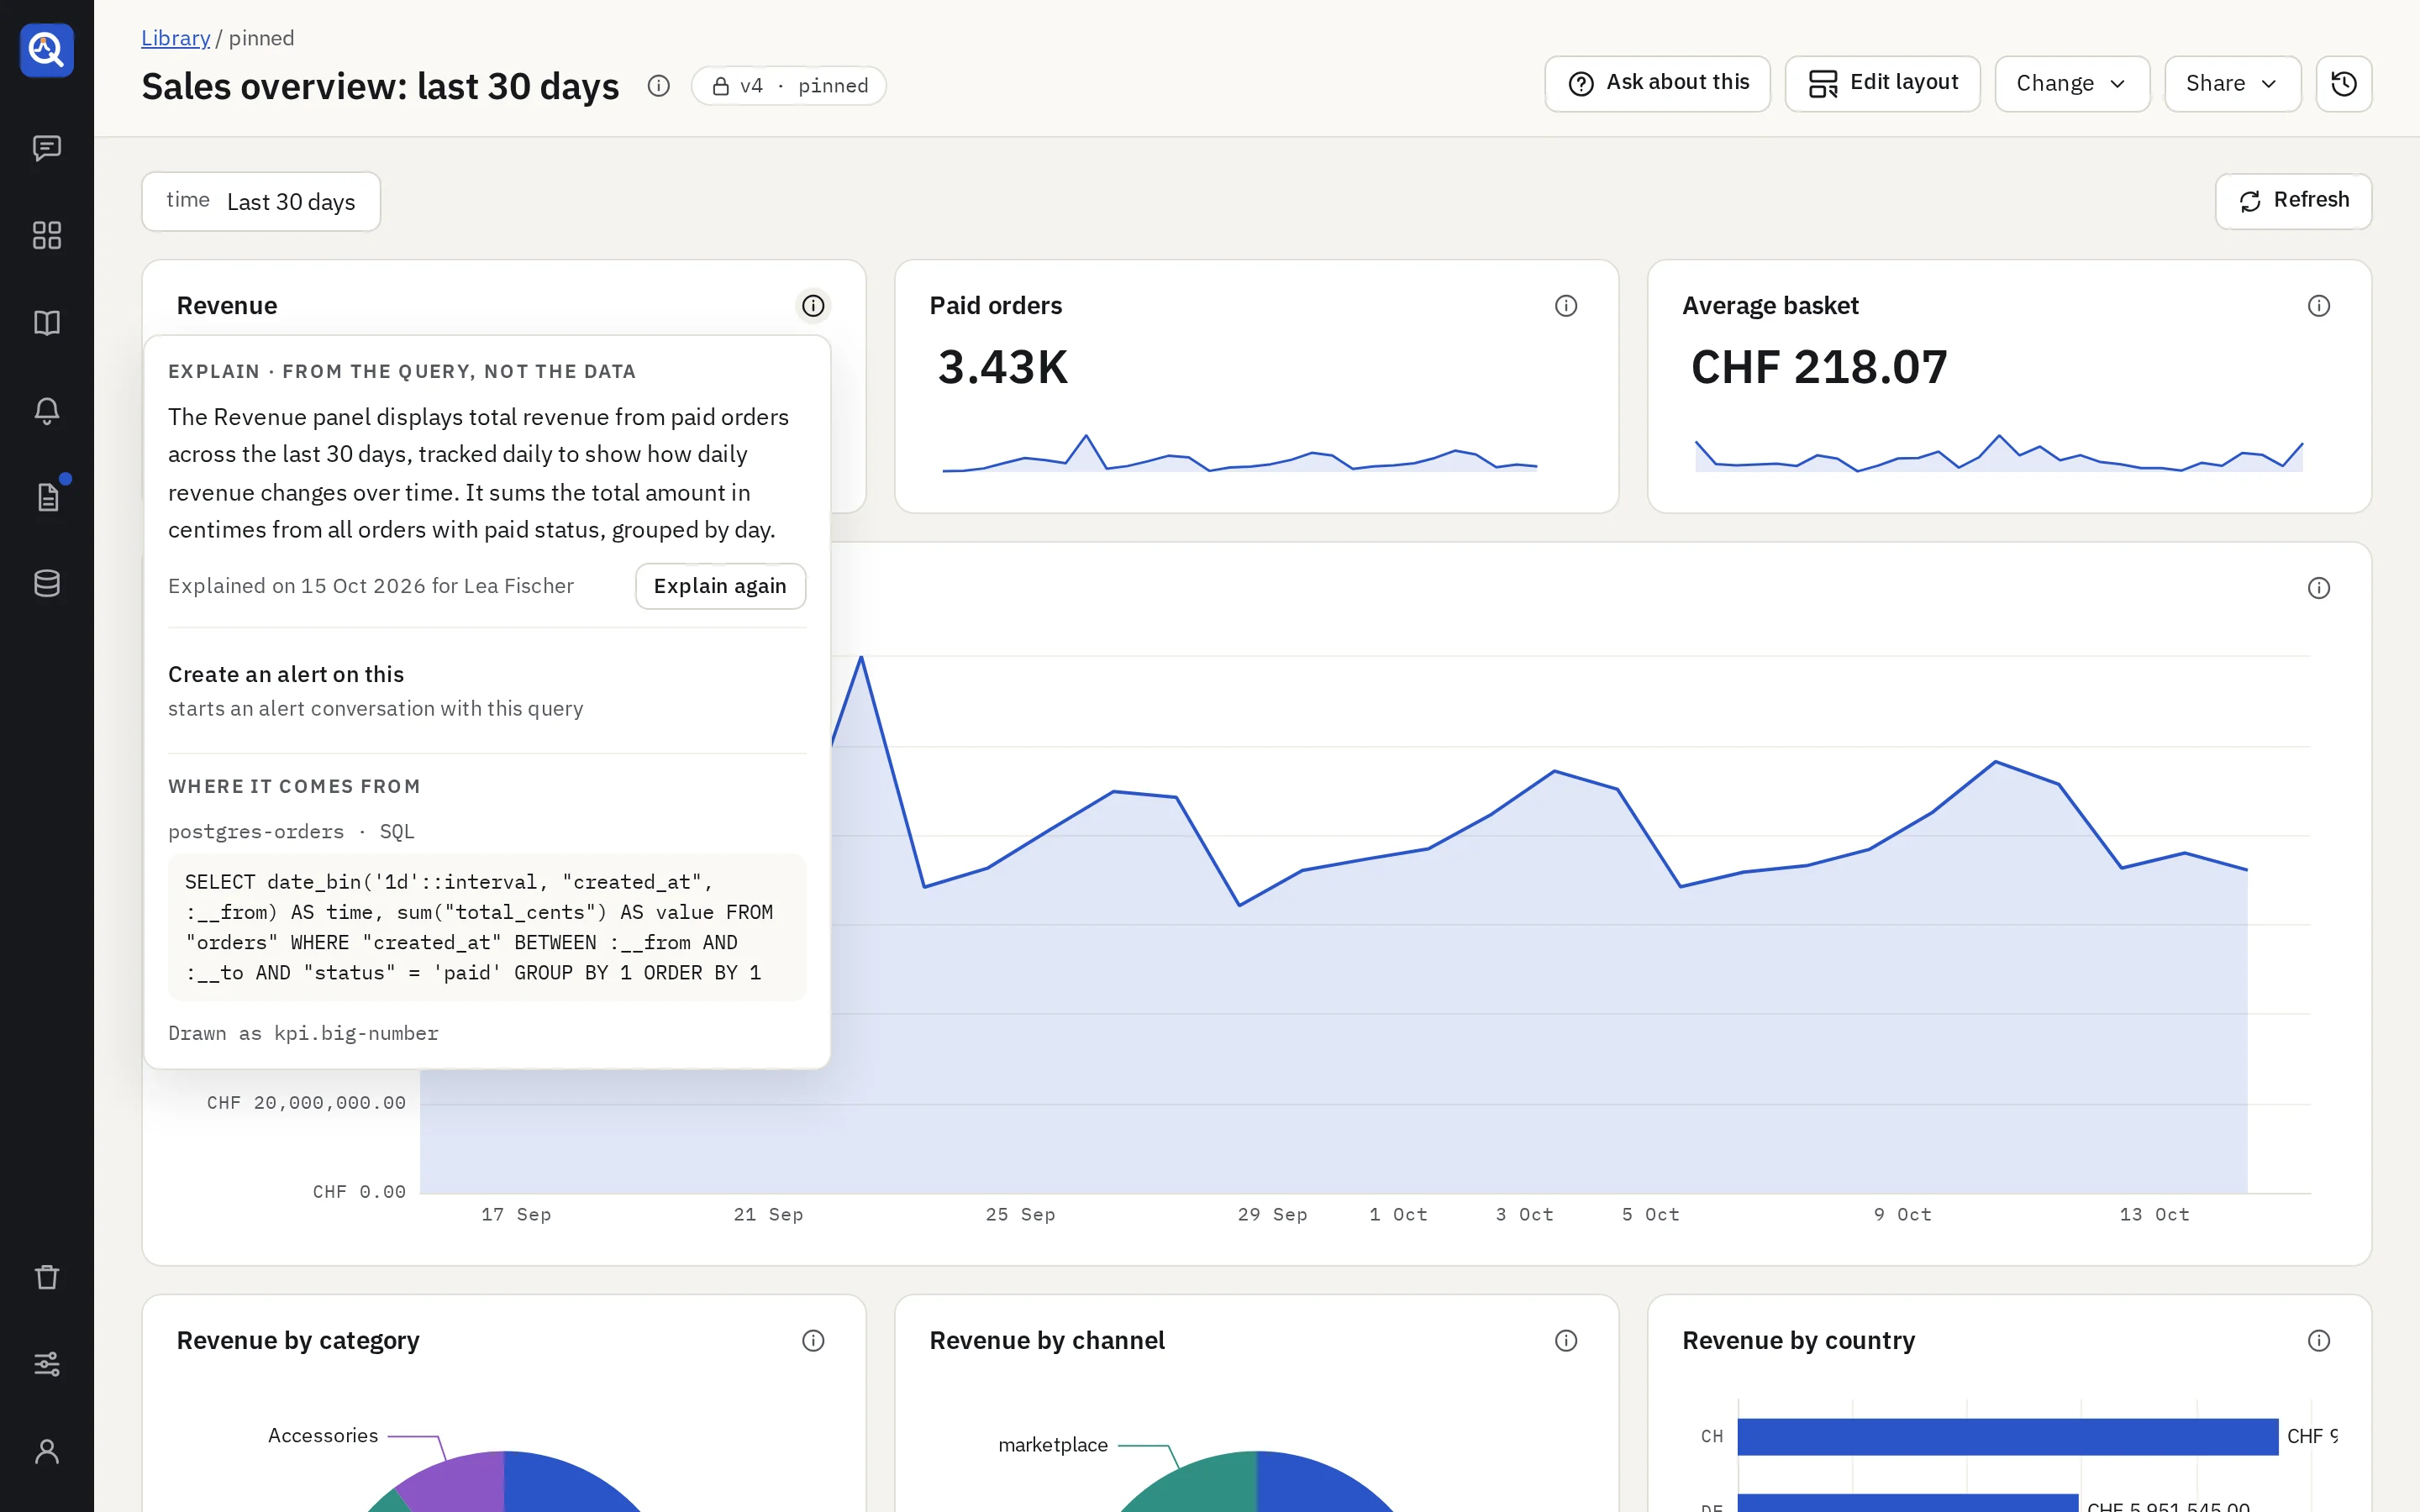
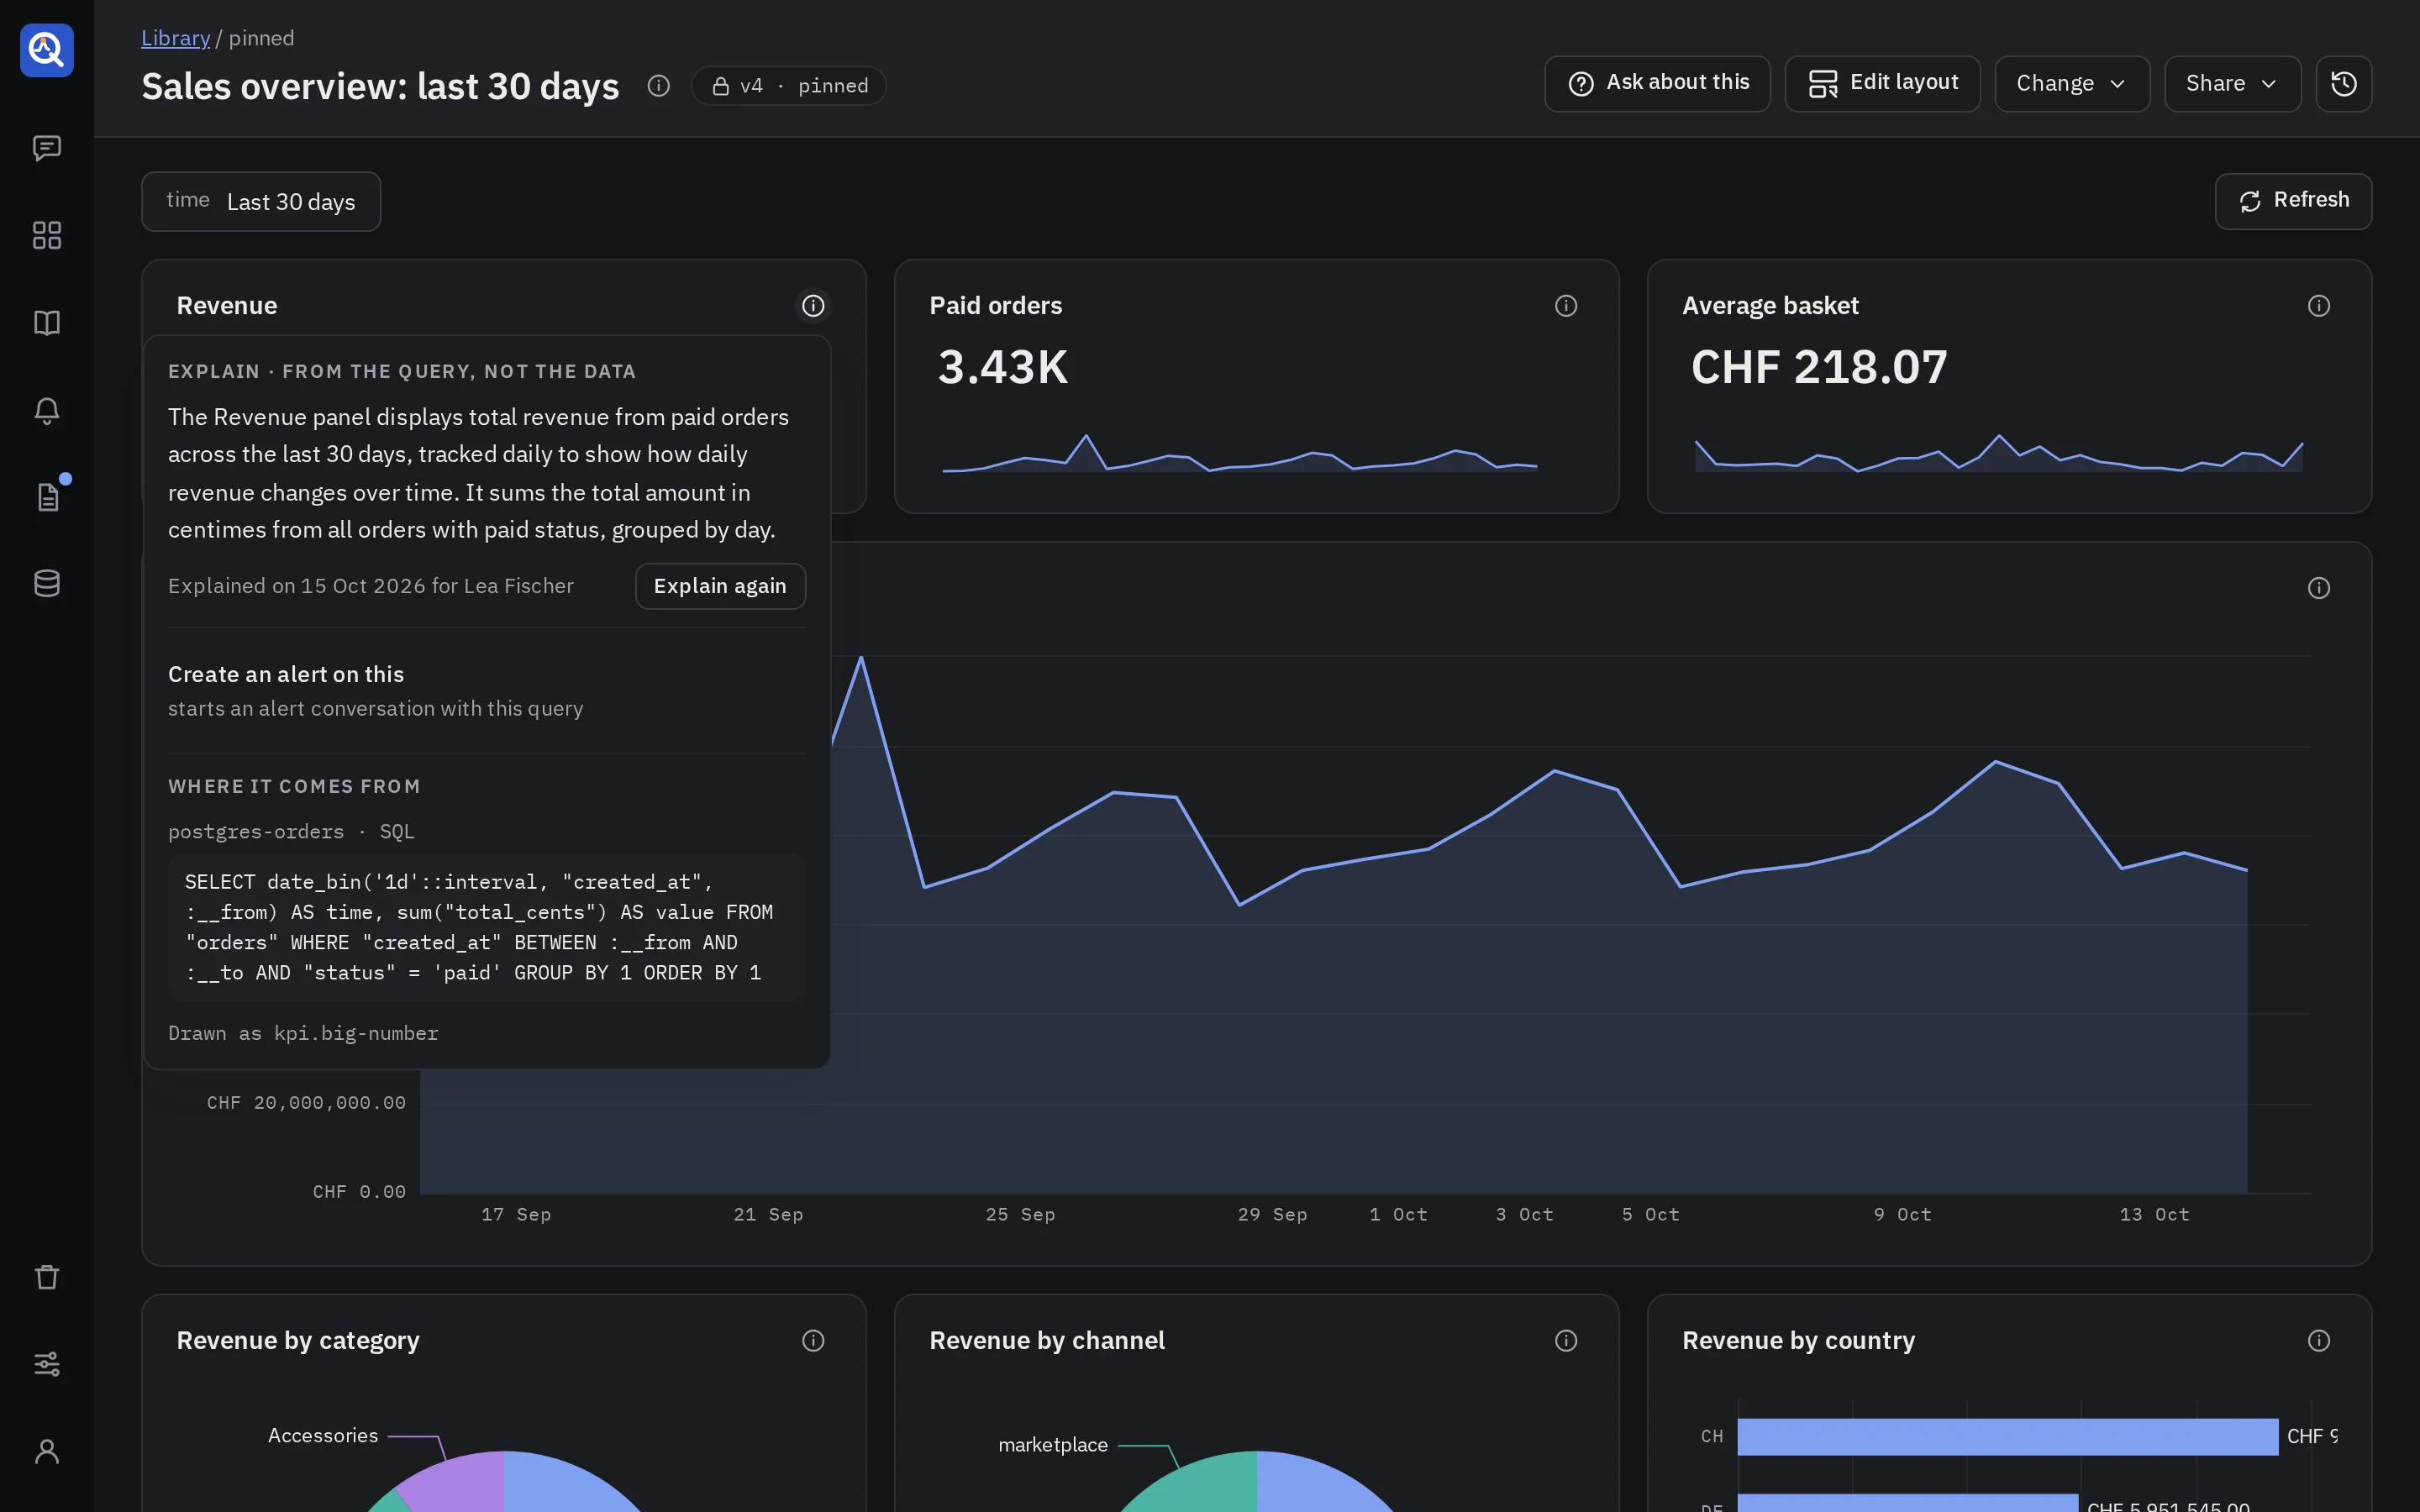
- Explain asks for one; it streams in and is kept for everyone. Explain again writes a new one in place of the latest.
- An explanation is written from the panel’s query and the source’s schema only, never from the data, so every role may read it, whatever the source’s access level.
- It says when it was written and for whom, since a source’s descriptions may change after.
- An explanation follows its panel to the next versions of the dashboard. On a version nobody explained yet, the bubble shows the latest explanation of an earlier version and names it: “Written for v2.”
- When the panel’s queries or view changed since that version, the bubble says so before the text: “This explains the panel as it was in v2. Its queries or its view changed since.” Explain again then writes one for the version shown. The comparison reads the panel’s own queries and view: a variable they use may have changed without it.
- A panel removed from the dashboard takes its explanation out of sight. Nothing is deleted: the earlier versions keep theirs.
- Viewers read an explanation once someone asked for it. Before that, the bubble says an analyst can ask for it.
Below the explanation, the bubble shows the source, the query and the chart recipe, so anyone can trace a number to where it comes from.
What it costs
Questions and explanations run on the answer model an admin picks in Settings → Model, and their tokens count in Settings → Usage under their own features. The limits per turn apply when they are set: the tool calls and the tokens. See Models and usage.