


Alerts
An alert watches one query and tells a channel when a condition holds: “tell me when checkout’s 5xx share stays above 2% for 5 minutes”. The agent writes it in a conversation, and the server checks it on a schedule with no model.
Editors write and activate alerts. Analysts also mute them. Every role reads them.
An alert’s drafts belong to the thread that wrote it. Its owner and admins see every version, and activate, deactivate, tune and test it. Other editors read it as every role does: once it is active, with the versions ever active.
Write one
Open Threads, pick An alert, and say what to watch, when it should fire and who hears:
Tell me when checkout’s 5xx share stays above 2% for 5 minutes, on the On-call channel.
From a dashboard, a panel’s info bubble offers Create an alert on this: the alert starts from that panel’s query, and the thread opens with a note naming the panel.
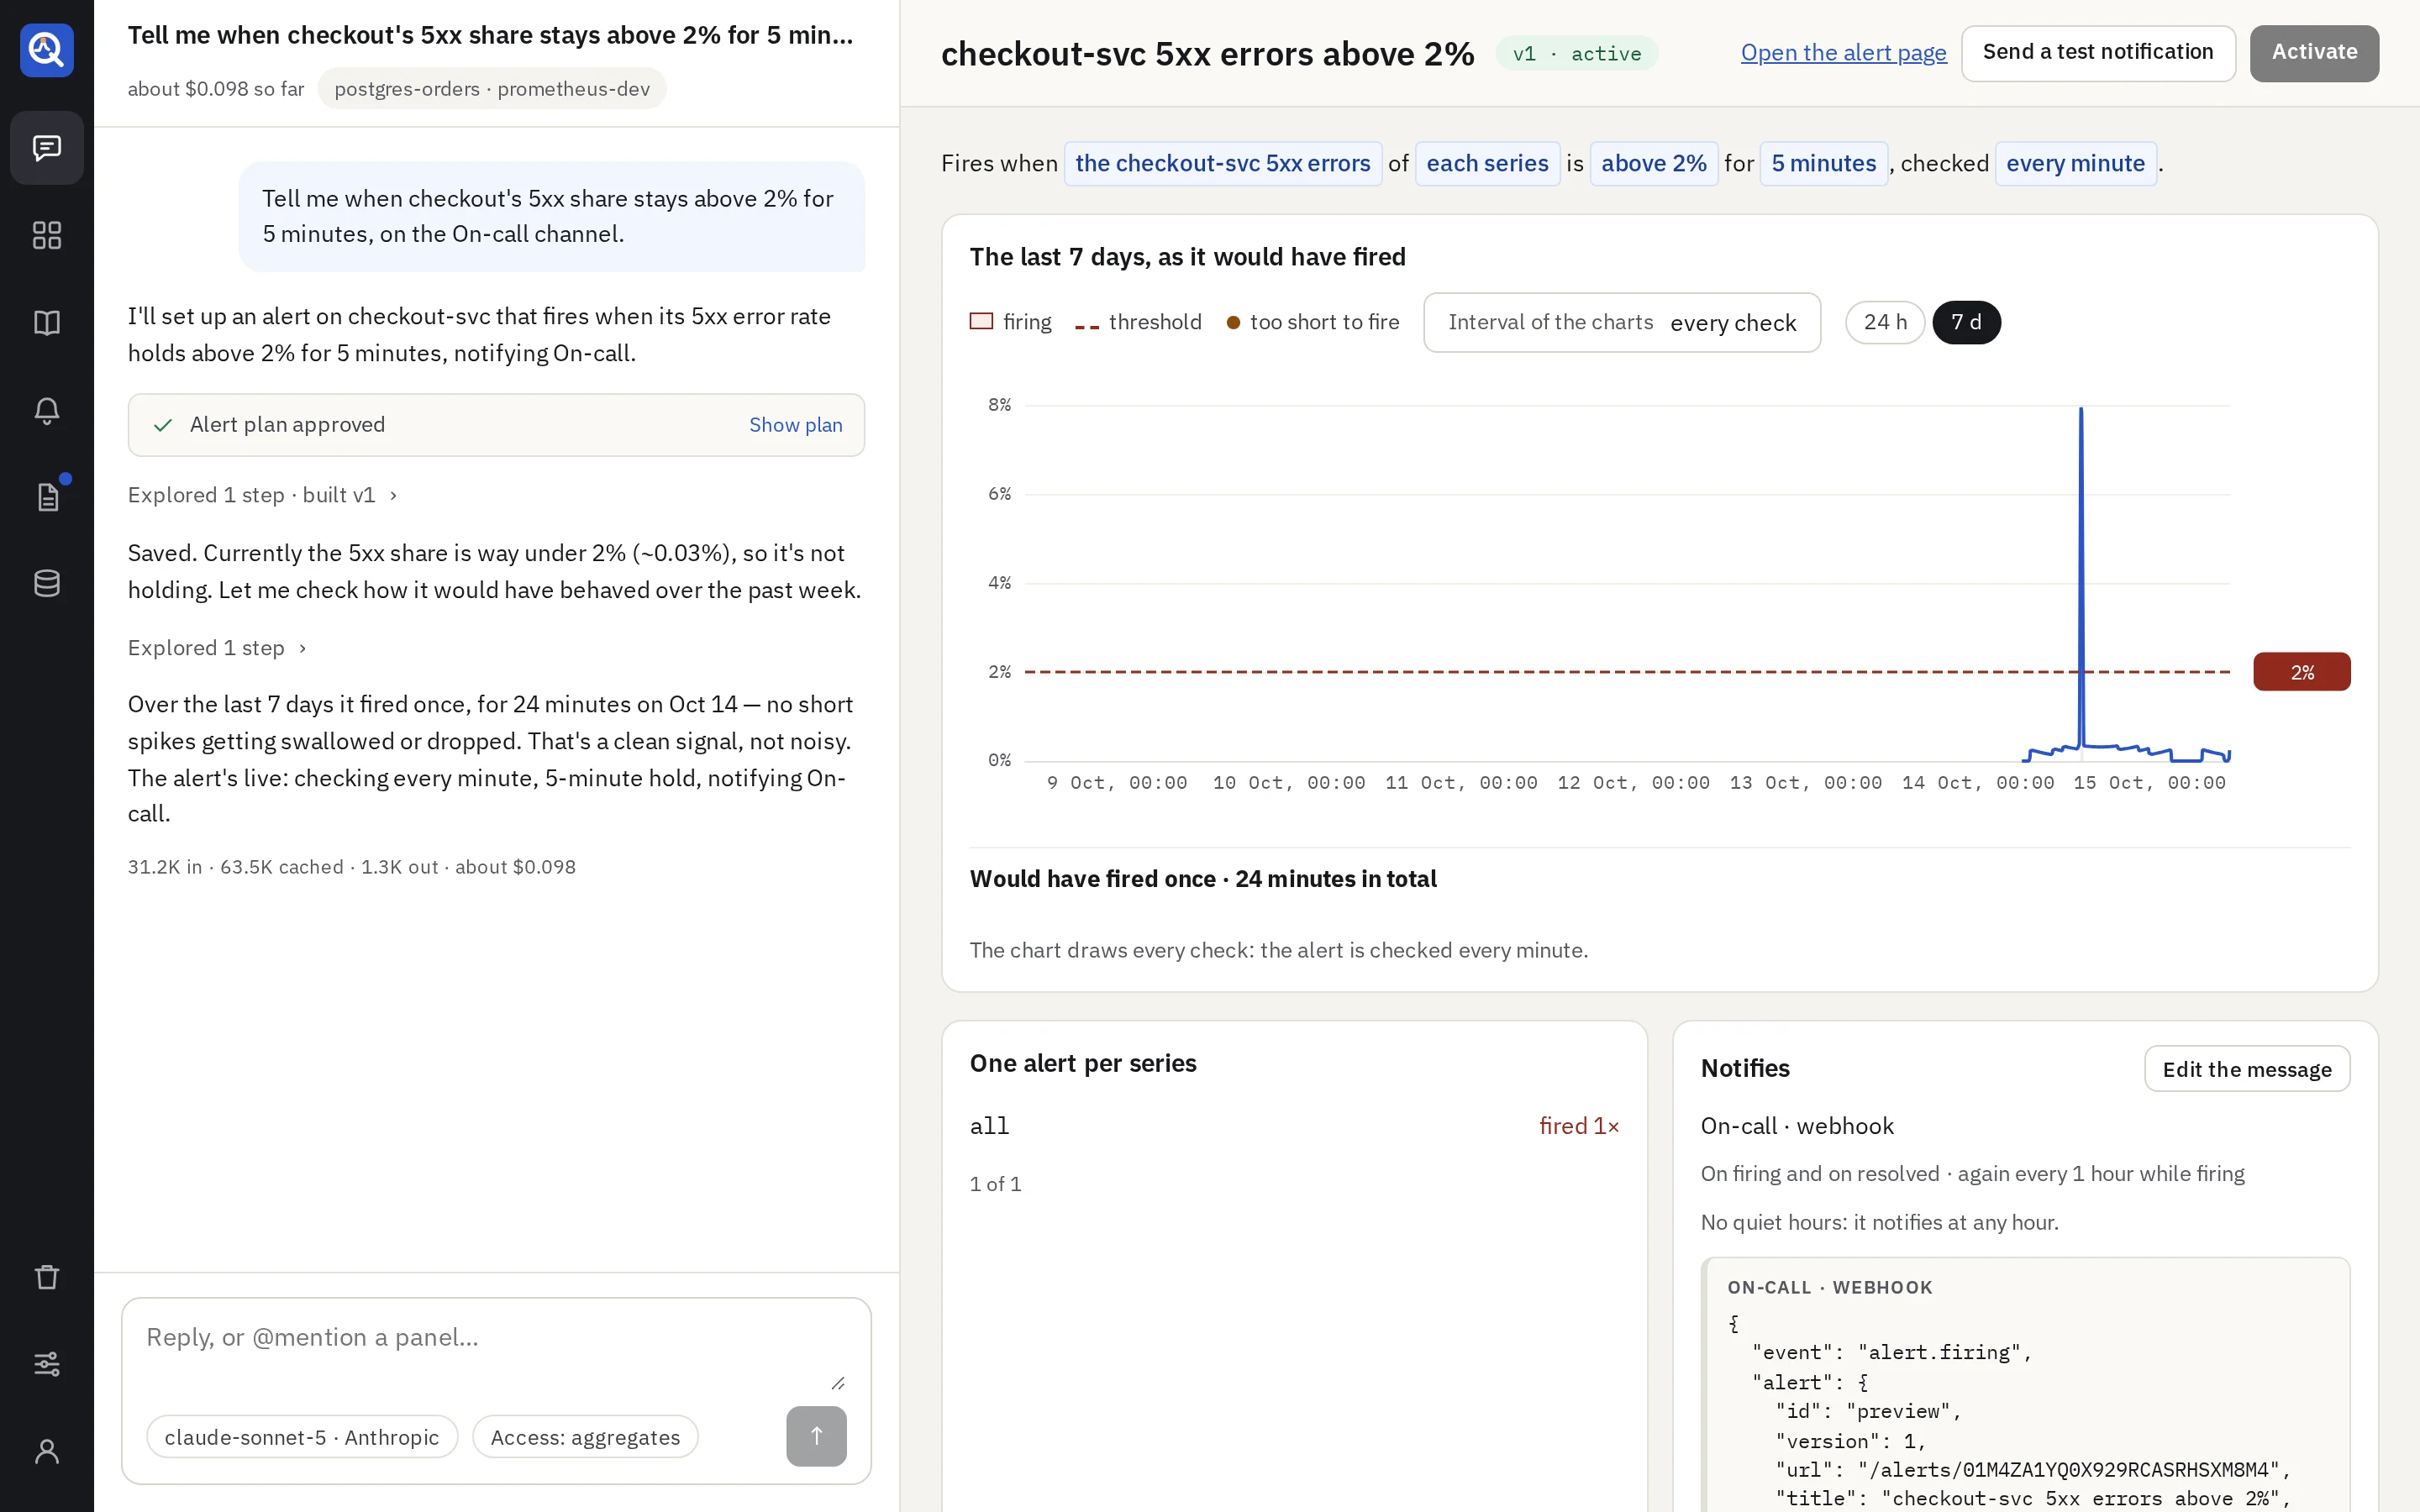
The agent proposes a plan: Watch (what, on which source), Fires when, Checks (how often) and Notifies (the channels). Approve & write, and the alert appears in the draft pane on the right.
Tune the draft
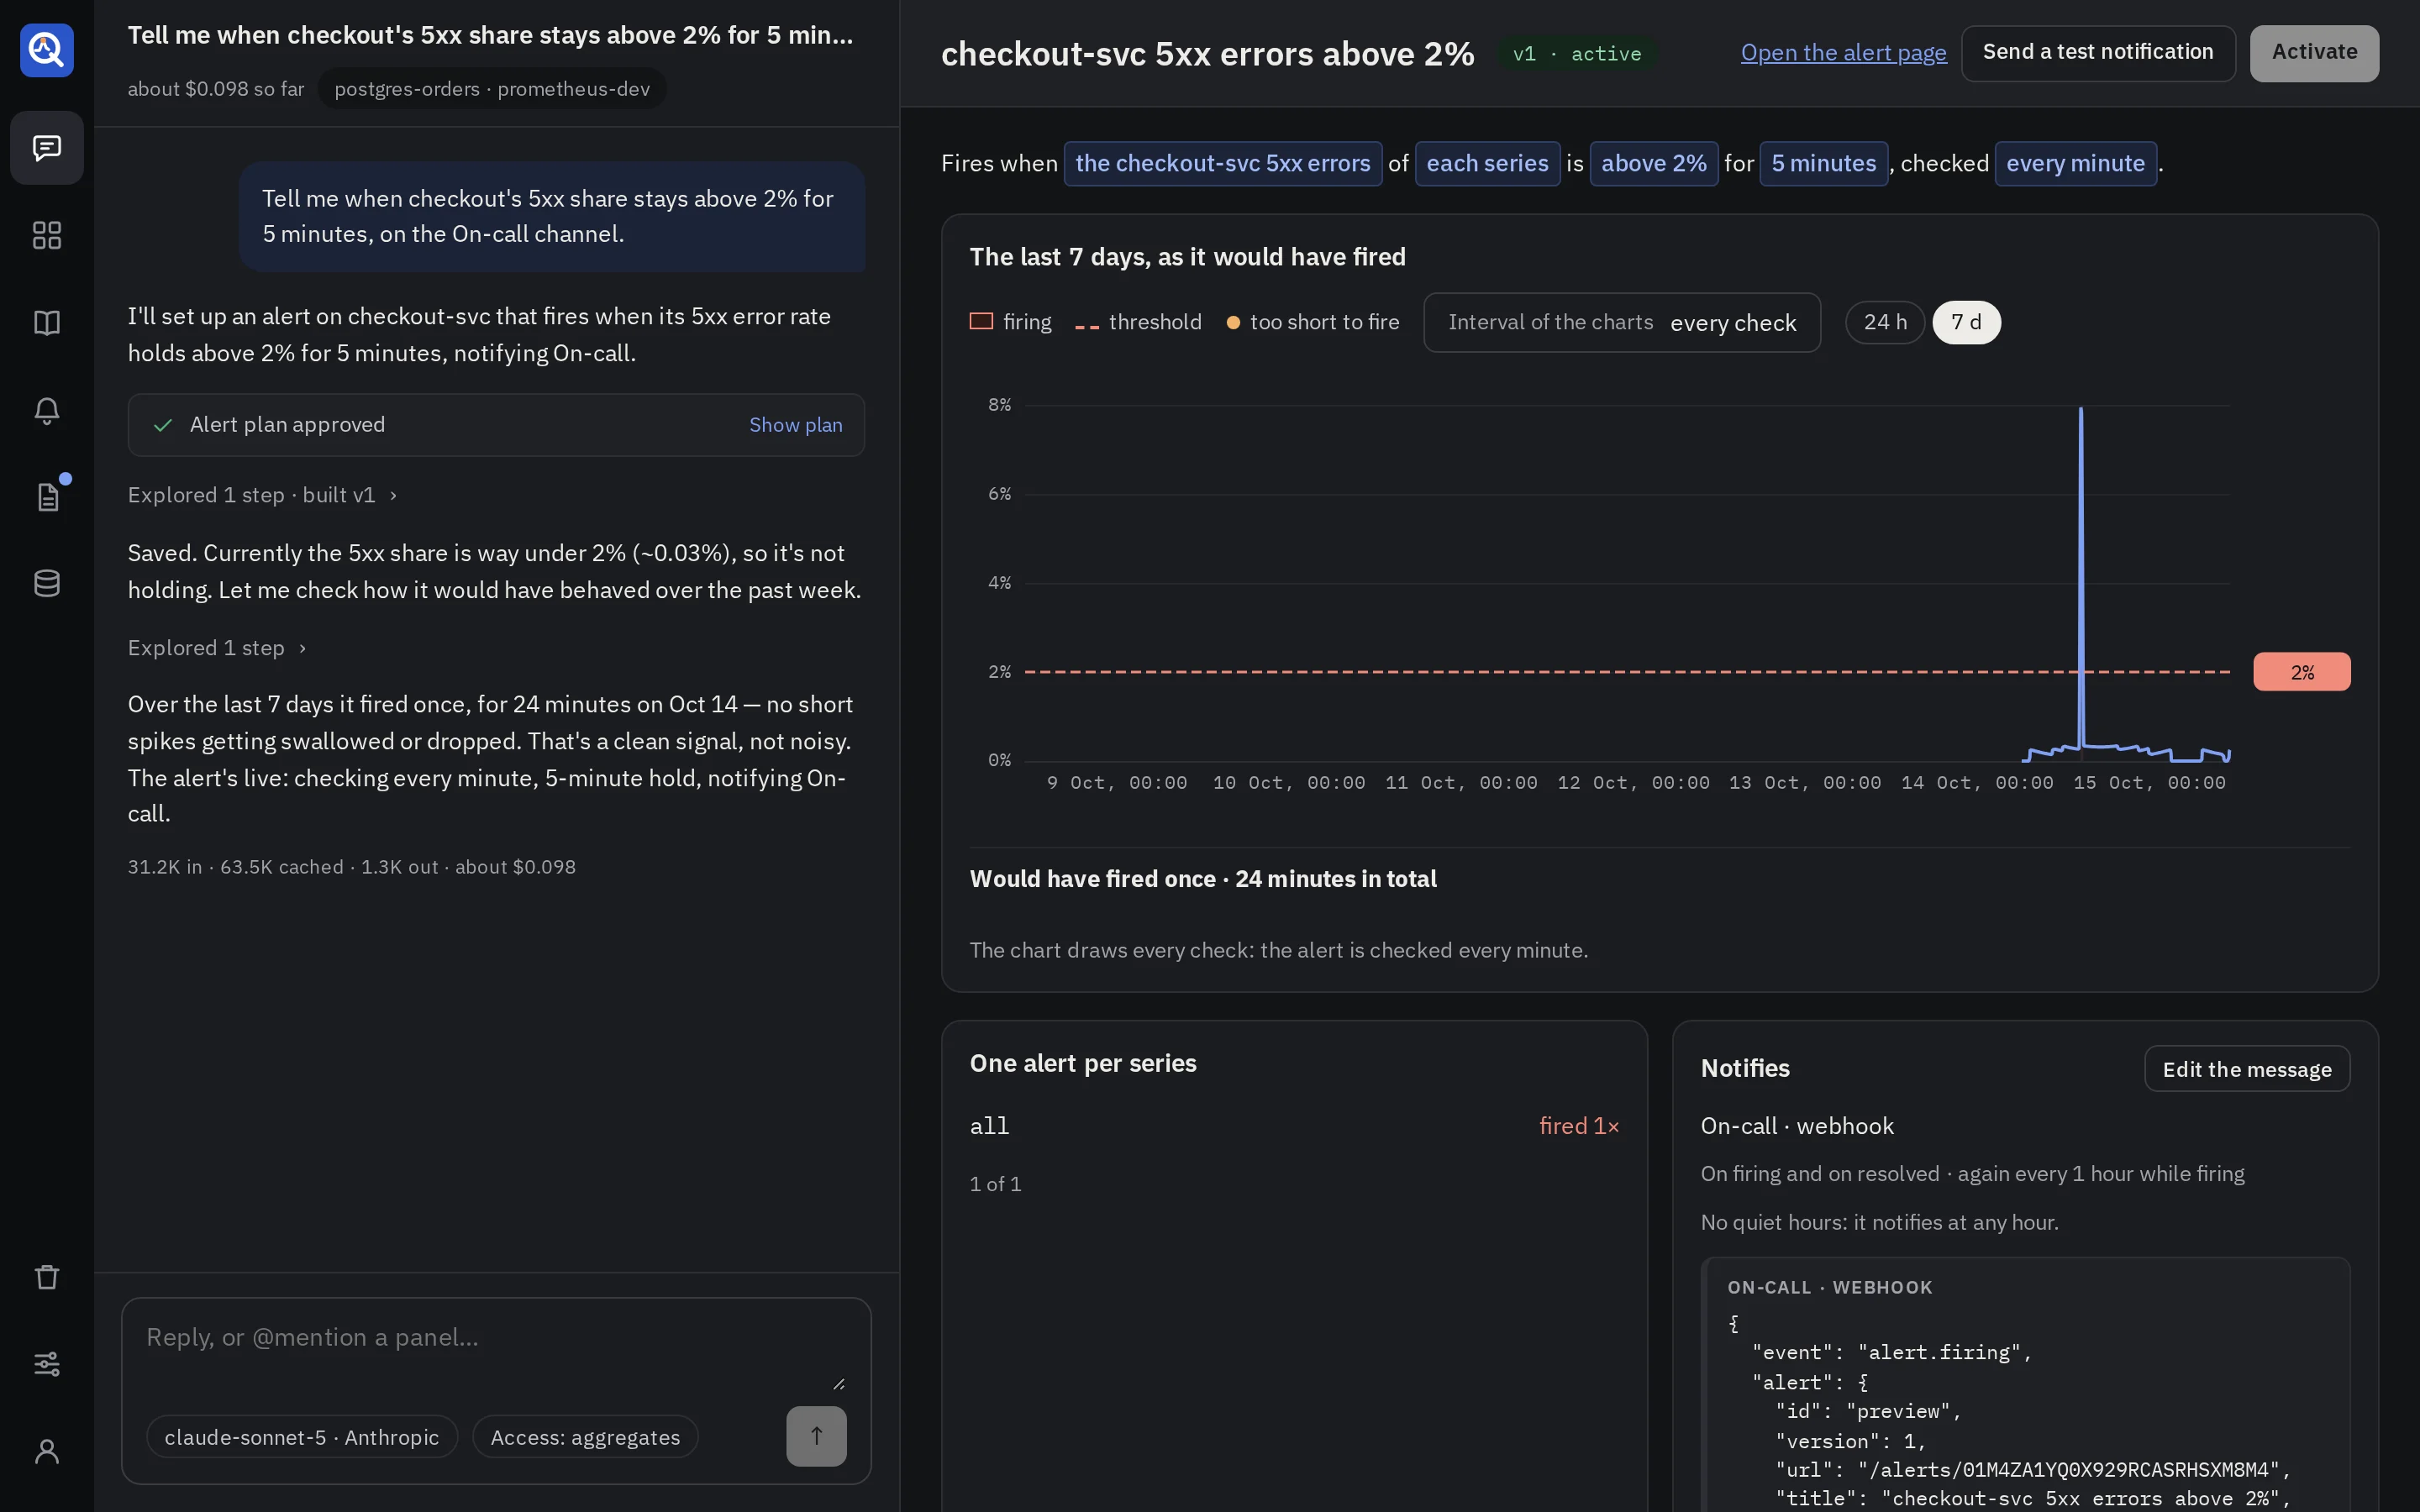
The draft pane shows what the alert would have done, before it ever runs:
- The condition as a sentence: “Fires when the error share of each service is above 2% for 5 minutes, checked every minute”. Each value is a button: click it to change it. A change reads “drops by at least 50% within 10 minutes”, and joined tests read one after the other, with the “and” or “or” between them a button too. A comparison with the past reads “is at least 30% above its value a week earlier”, and a band “is more than 3 deviations from its mean of the last day”. The sentence changes values; ask the agent to add or remove a test.
- The replay over the last 7 days or 24 hours, with the threshold as a dashed line. Drag the handle at its right, or use the arrow keys, and the shading, the summary (“Would have fired 2 times · 23 minutes in total · 1 spike too short to fire”) and the series follow at once. A change has no fixed line: the dashed line is the value the series must reach to fire, and it moves with the series. With several series it is drawn for the one that fired longest. A comparison with the past adds a dotted line, the value a week (or a day, or an hour) earlier, and a band is drawn as a shaded range: the series fires where it leaves it. The $interval chip chooses how fine the line is drawn: see the interval of the chart.
- The series: one per service, host or label value, each with how often it would have fired, ten at a time.
- Notifies: the channels, when the alert is quiet and when it may next notify, and a preview
of the message as each service shows it: a Slack
message, a Discord embed, a Teams card, a PagerDuty incident, an Alertmanager alert, a
webhook’s JSON. Edit the message changes its title, body and fields. Besides
{value}and{threshold}, a message can name{change}(how far a change moved, such as-52%),{previous}(the value it moved from),{band}(the band of a band, such as1.2% to 2.4%),{values}(the value of every joined test), and{numerator}and{denominator}(the two sides of a ratio).
Every change you make here is saved as a new draft version, and the agent reads it on its next turn (“I changed the alert by hand, v1 → v2: threshold 3% → 2%”). Keep talking to change anything else.
- Send a test notification sends the message to its channels, marked as a test.
- Activate starts checking it. Activating runs its query once, and refuses a query that fails.
What fires
Each check runs the query over a recent window and turns the result into series: one per row of label values, or one per time series.
- A series the condition holds for is pending, then firing once that held for the wait you set. A wait of 0 fires at once.
- When it stops holding, it is resolved: the channel hears so, unless you turned that off.
- While it keeps firing, the alert can repeat its message at an interval you set. An Alertmanager needs no repeat: it is told at every check that the series still fires.
- No data: an alert can fire when the query returns nothing for a while.
- Cannot be checked: when the query fails twice in a row, the source down or the credentials wrong, the channel hears once, and again when it can be checked. An admin can turn that off.
Conditions
Say what should fire in your own words; the agent picks the condition and the draft shows it as a sentence. There are six kinds, and nothing else: no formula to write. An alert can also watch a ratio of two queries.
| Condition | Say | Fires when |
|---|---|---|
| Threshold | “error share above 2% for 5 minutes” | the value is above, or below, a fixed number |
| Change | “orders dropped by half in 10 minutes” | the value rose or dropped by an amount, or more, within a duration |
| Against the past | “30% above the same hour last week” | the value is that far above, or below, its value a period earlier |
| Band | “latency is unusual” | the value is outside the range its own recent history gives |
| Joined tests | “above 2% and at least 100 requests” | every one of two to four tests holds, or any one of them |
| No data | “nothing came in for 10 minutes” | the query returns nothing |
Every kind has a wait: how long it must hold before a series fires. The sentence ends with it, “for 5 minutes” or “at once”. Quiet hours and mutes work the same for every kind: the alert is still checked, and only its messages wait.
Threshold
Fires when the error share of each service is above 2% for 5 minutes, checked every minute.
The value is above, or below, a fixed number. Use it when you know the number that is too much.
- The number reads in the alert’s format: 2% for a share, 500 ms for a latency.
- Drag the dashed line on the replay to try another number.
Change
Fires when the order count of each channel drops by at least 50% within 10 minutes at once, checked every minute.
A change compares the latest value with the value a while earlier: 10 minutes earlier for “within 10 minutes”. Use it when the normal level moves through the day and no fixed number fits.
- The amount is a percentage of the earlier value (“by half” is 50%), or a difference in the value itself (“by 200”).
- For a value that is a share, a difference reads in percentage points: from 5% to 10% is “by 5 percentage points”, and “by 5%” would be from 5% to 5.25%.
- It needs a value from that long ago. A series that just appeared does not fire.
- A percentage of zero is not a number, so a series that was at 0 does not fire on a percentage. Use a difference for a series that rests at zero.
- It resolves by itself once the earlier value has caught up, 10 minutes after the move in this example, even when the value stays where it went. To hear for as long as a level lasts, use a threshold, alone or joined with the change.
Against the past
Fires when the order count of each channel is at least 30% above its value a week earlier for 10 minutes, checked every 5 minutes.
It compares the value with the value of the same window an hour, a day or a week earlier. Use it for what follows the clock or the calendar, such as traffic, orders and sign-ins: Monday at 9 is compared with last Monday at 9, not with Sunday night.
- The amount is a percentage of the value then, or a difference in the value itself, above or below.
- A day earlier is exactly 24 hours earlier, and a week 168 hours. For a day or a week after the clocks change, the window then is an hour off on the local clock.
- The window is the alert’s own: with a window of an hour, it is this hour against the same hour a week earlier.
- A series with no value then does not fire: a series that is new, or data that does not go back that far. The agent is told when no series has a value then, and the alert is not saved.
- A percentage of zero is not a number, so a series that was at 0 then does not fire on a percentage. Use a difference.
Band
Fires when the p95 latency of each service is more than 3 deviations from its mean of the last day for 5 minutes, checked every 5 minutes.
A band asks whether the value is unusual for this series. It takes the mean of the series over a baseline before the window, 1 hour to 7 days, and the band reaches a number of standard deviations each side of it, 3 unless you say otherwise. The series fires above the band, below it, or on either side.
- Each series has its own band, learned again at every check, so it follows a level that drifts.
- Fewer deviations fire more often: 2 is noisy, 4 fires on little.
- With too little history there is no verdict, and it never fires: fewer than 10 points over the baseline, or points that cover less than half of it. A new series waits until it has that much.
- A series that never moved has a band of one value, so any other value is outside it. Join the band with a threshold to ignore small numbers.
- The band is learned from the single points of the baseline, so the value is the latest point of the window or the mean of its points, never their sum, maximum or minimum.
- A band knows nothing of the hour or the weekday. For a level with a daily or weekly shape, compare against the past instead.
- The band and the value must be on one scale. A PromQL or LogQL query of a band writes its
windows out (
[5m]): a duration that follows the time range would be another over the baseline, and is refused. A SQL, search or MongoDB query still cuts time by the interval, as every alert’s does: the alert binds the same width over the baseline as over the window.
Against the past and a band read history, so each check runs a second query on the data source: the same window a period earlier, or the whole baseline. Check such an alert every 5 minutes or more rather than every minute, and keep the baseline as short as holds the normal ups and downs. A condition has at most one test that reads history, and such an alert counts twice towards the most alerts active per connector.
Joined tests
Fires when, for each service, the error share is above 2% and requests is above 100, for 5 minutes, checked every minute.
Joined tests watch several numbers of one query, such as the error share and the request count of each service, so that a share on three requests wakes nobody.
- A test is a threshold, a change, a comparison with the past or a band. Two to four are joined, and joined tests are never joined again.
- The query returns each number as its own column. Each test reads one, with its own format.
- The sentence changes each test’s numbers and the column it reads. How a later test turns the points of its window into one value (the latest, the mean, the sum) and how its number is written are the agent’s to set: ask in the conversation. The sentence does not show them.
- “And” needs every test to hold, “or” one of them.
- The value the alert shows, on its page, on the chart and as
{value}in the message, is the first test’s. - A test with no value for a series does not hold for it.
No data
Fires when the query returns no value for 10 minutes, checked every minute.
The query returns nothing at all. Use it for what should never stop: a heartbeat, a feed, a job that reports.
- It is about the query as a whole, not about one series. A series that disappears while others remain does not fire it.
- It cannot be joined with other tests, and it does not fit a ratio of two queries.
A ratio of two queries
An alert can watch one query divided by another: errors as a share of requests, failed jobs out of all jobs. Say “the errors in the logs as a share of the requests in the warehouse”, and the agent writes a second query. The sentence then reads “the errors of each service, divided by the requests of the second query (0 when that is 0), is above 5%”.
Use it when the two numbers live in two data sources, or in two places one query cannot join. When one query can divide them, the agent lets the query divide: that is one query per check, not two.
- Series are matched by their labels. The errors of
service=checkoutare divided by the requests ofservice=checkout. Two series match when every label they both have has the same value, and a label only one of them has is not compared. So a total per service divides each status code of that service, and a total with no labels divides every series. - A series needs exactly one match. With none, or with more than one, it has no value and does not fire. A series that was firing when its match went away resolves after three checks, as a series that left the result does. The agent is told when no series matches at all, and the alert is not saved.
- A second query that returns nothing while the first returns series means the alert cannot be checked, and it says so as for a query that fails.
- The series are the first query’s. A service with requests and no row of errors is not a series: write the first query so that it returns 0.
- When the second query is 0, the ratio is 0: there is nothing to take a share of. Click that part of the sentence to make it no value instead, which never fires. Do so for an alert that fires below a number, such as a success share under 99%, or every quiet minute fires.
- What can compare it. A threshold or a change, and joined tests: “error share above 5% and at least 100 errors”. Against the past and a band cannot read a ratio, nor can no data. For those, the query has to divide.
- The value on the alert’s page, on the chart and as
{value}is the ratio. A message can name both sides with{numerator}and{denominator}. - Each check runs both queries, each within the limits of its own data source. The alert counts towards the most alerts active on each of the two.
- The agent sees the result as the weaker of the two data sources’ access levels allows.
The alerts list
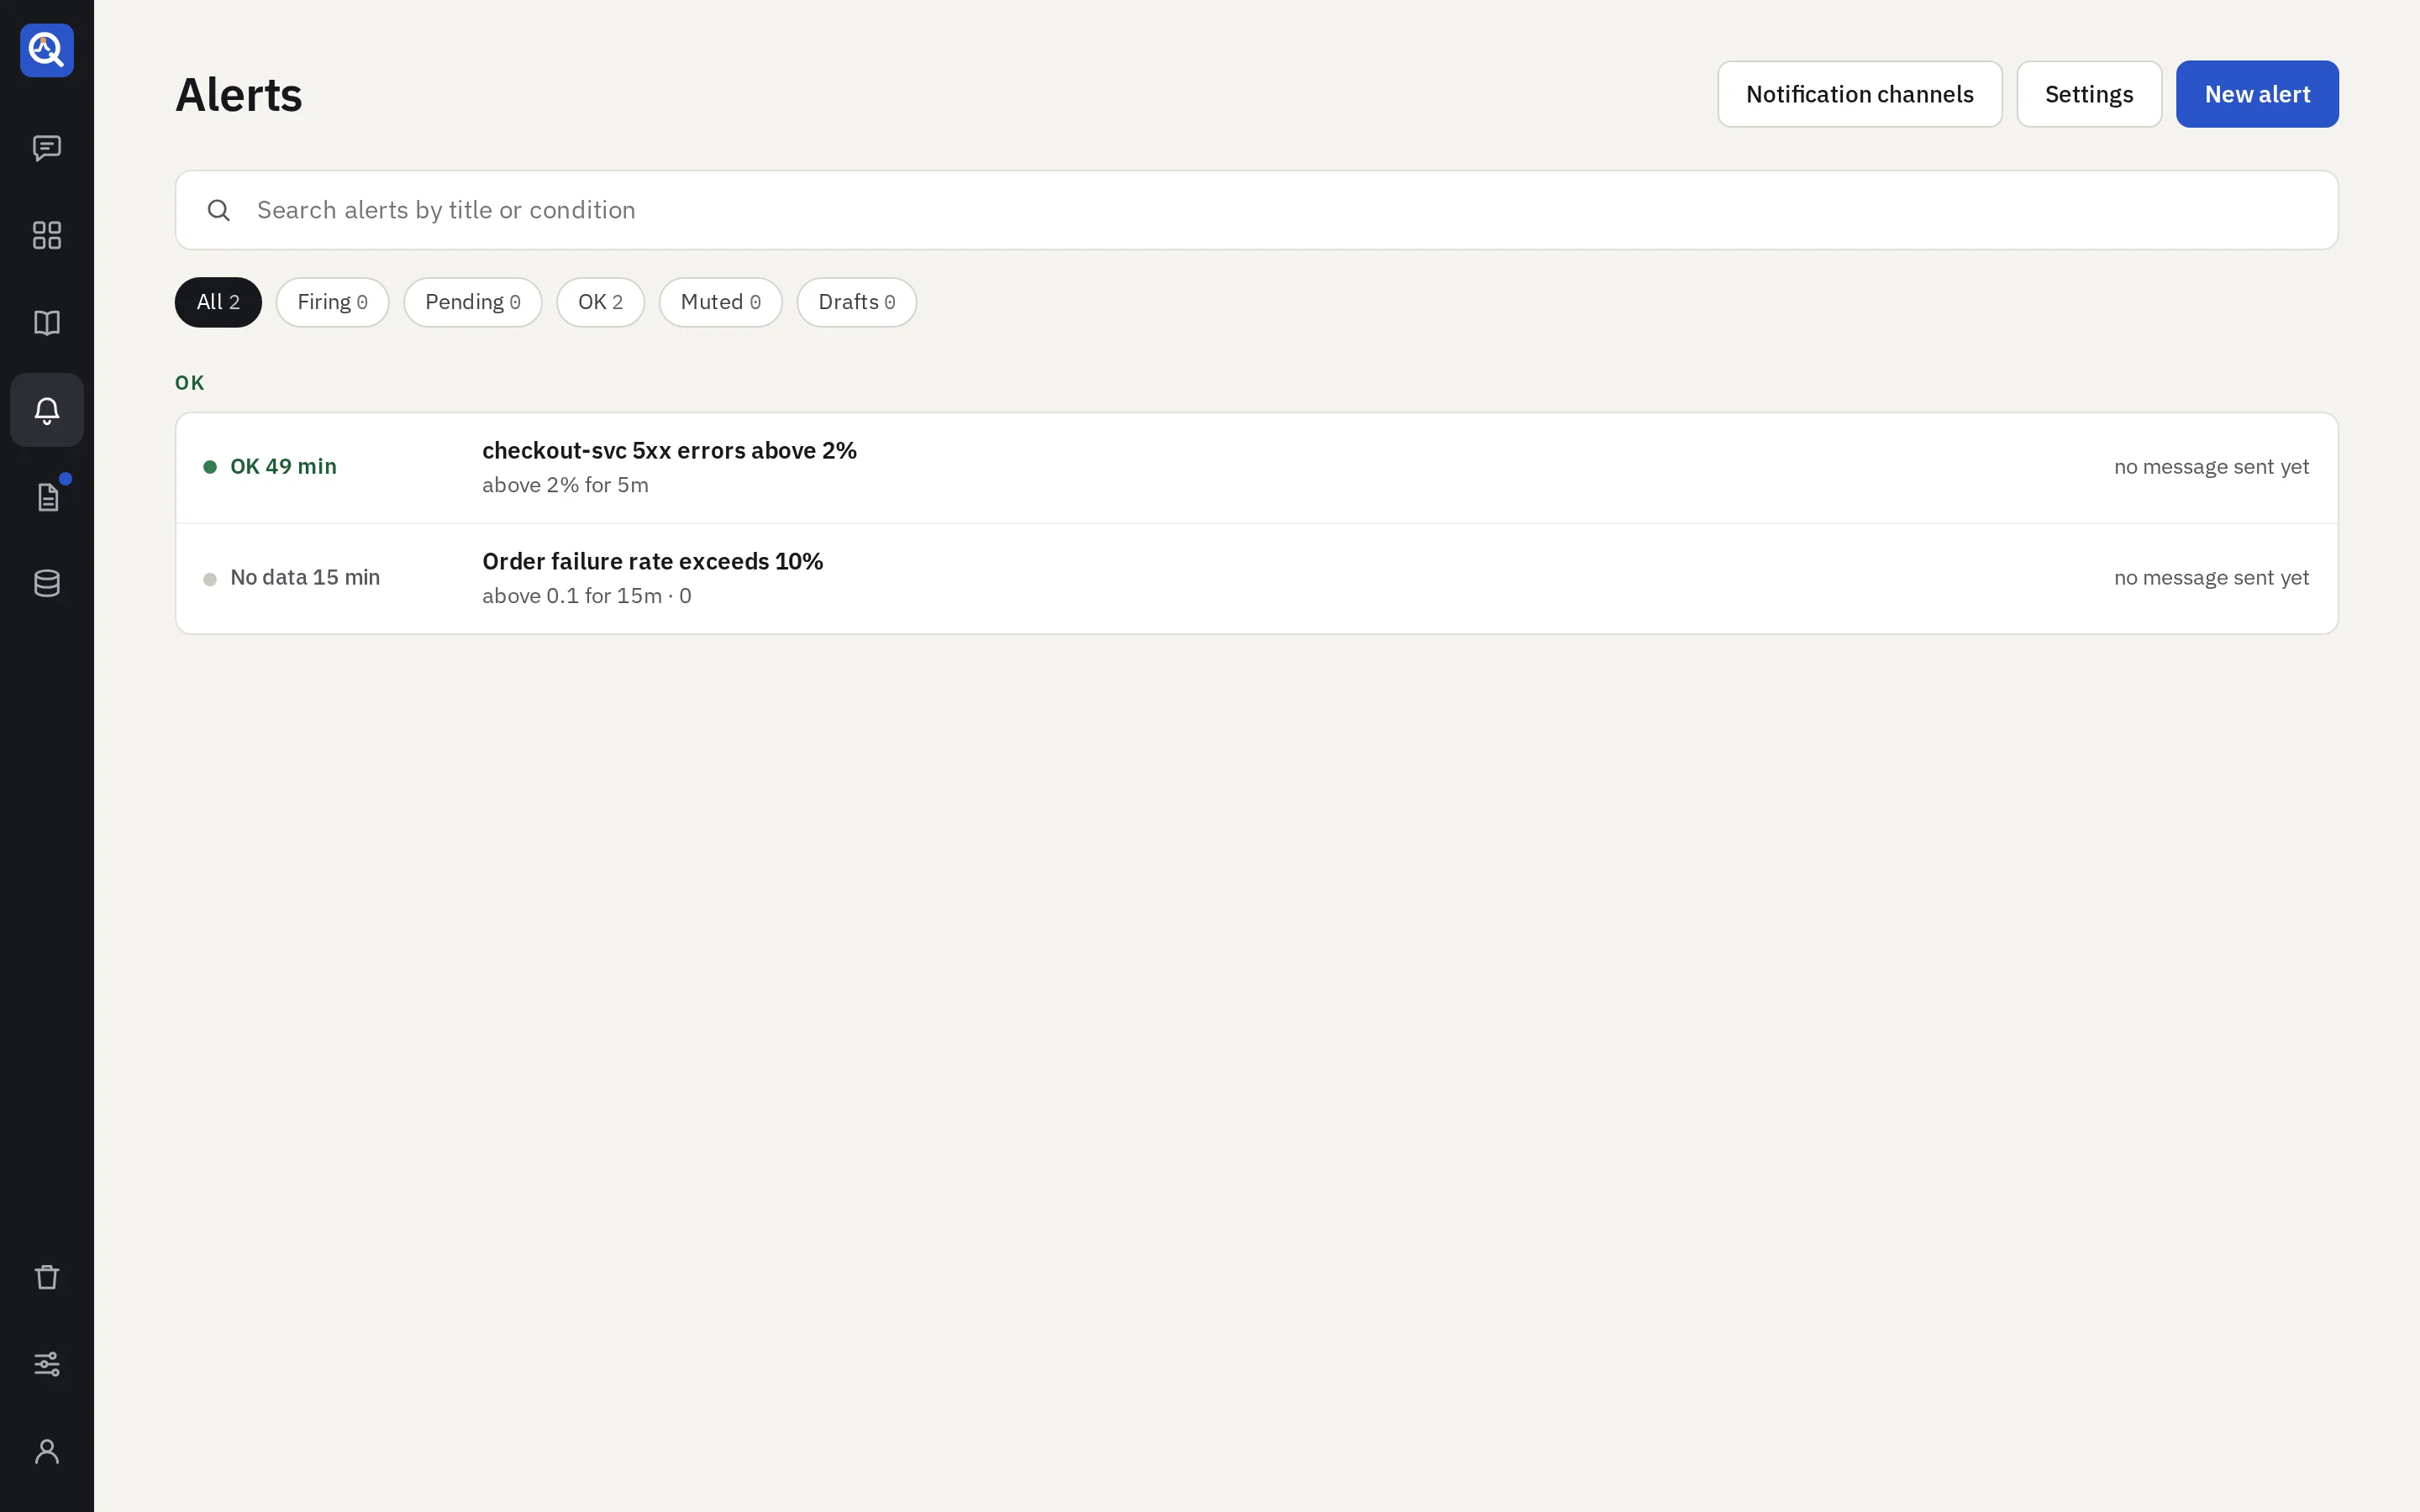
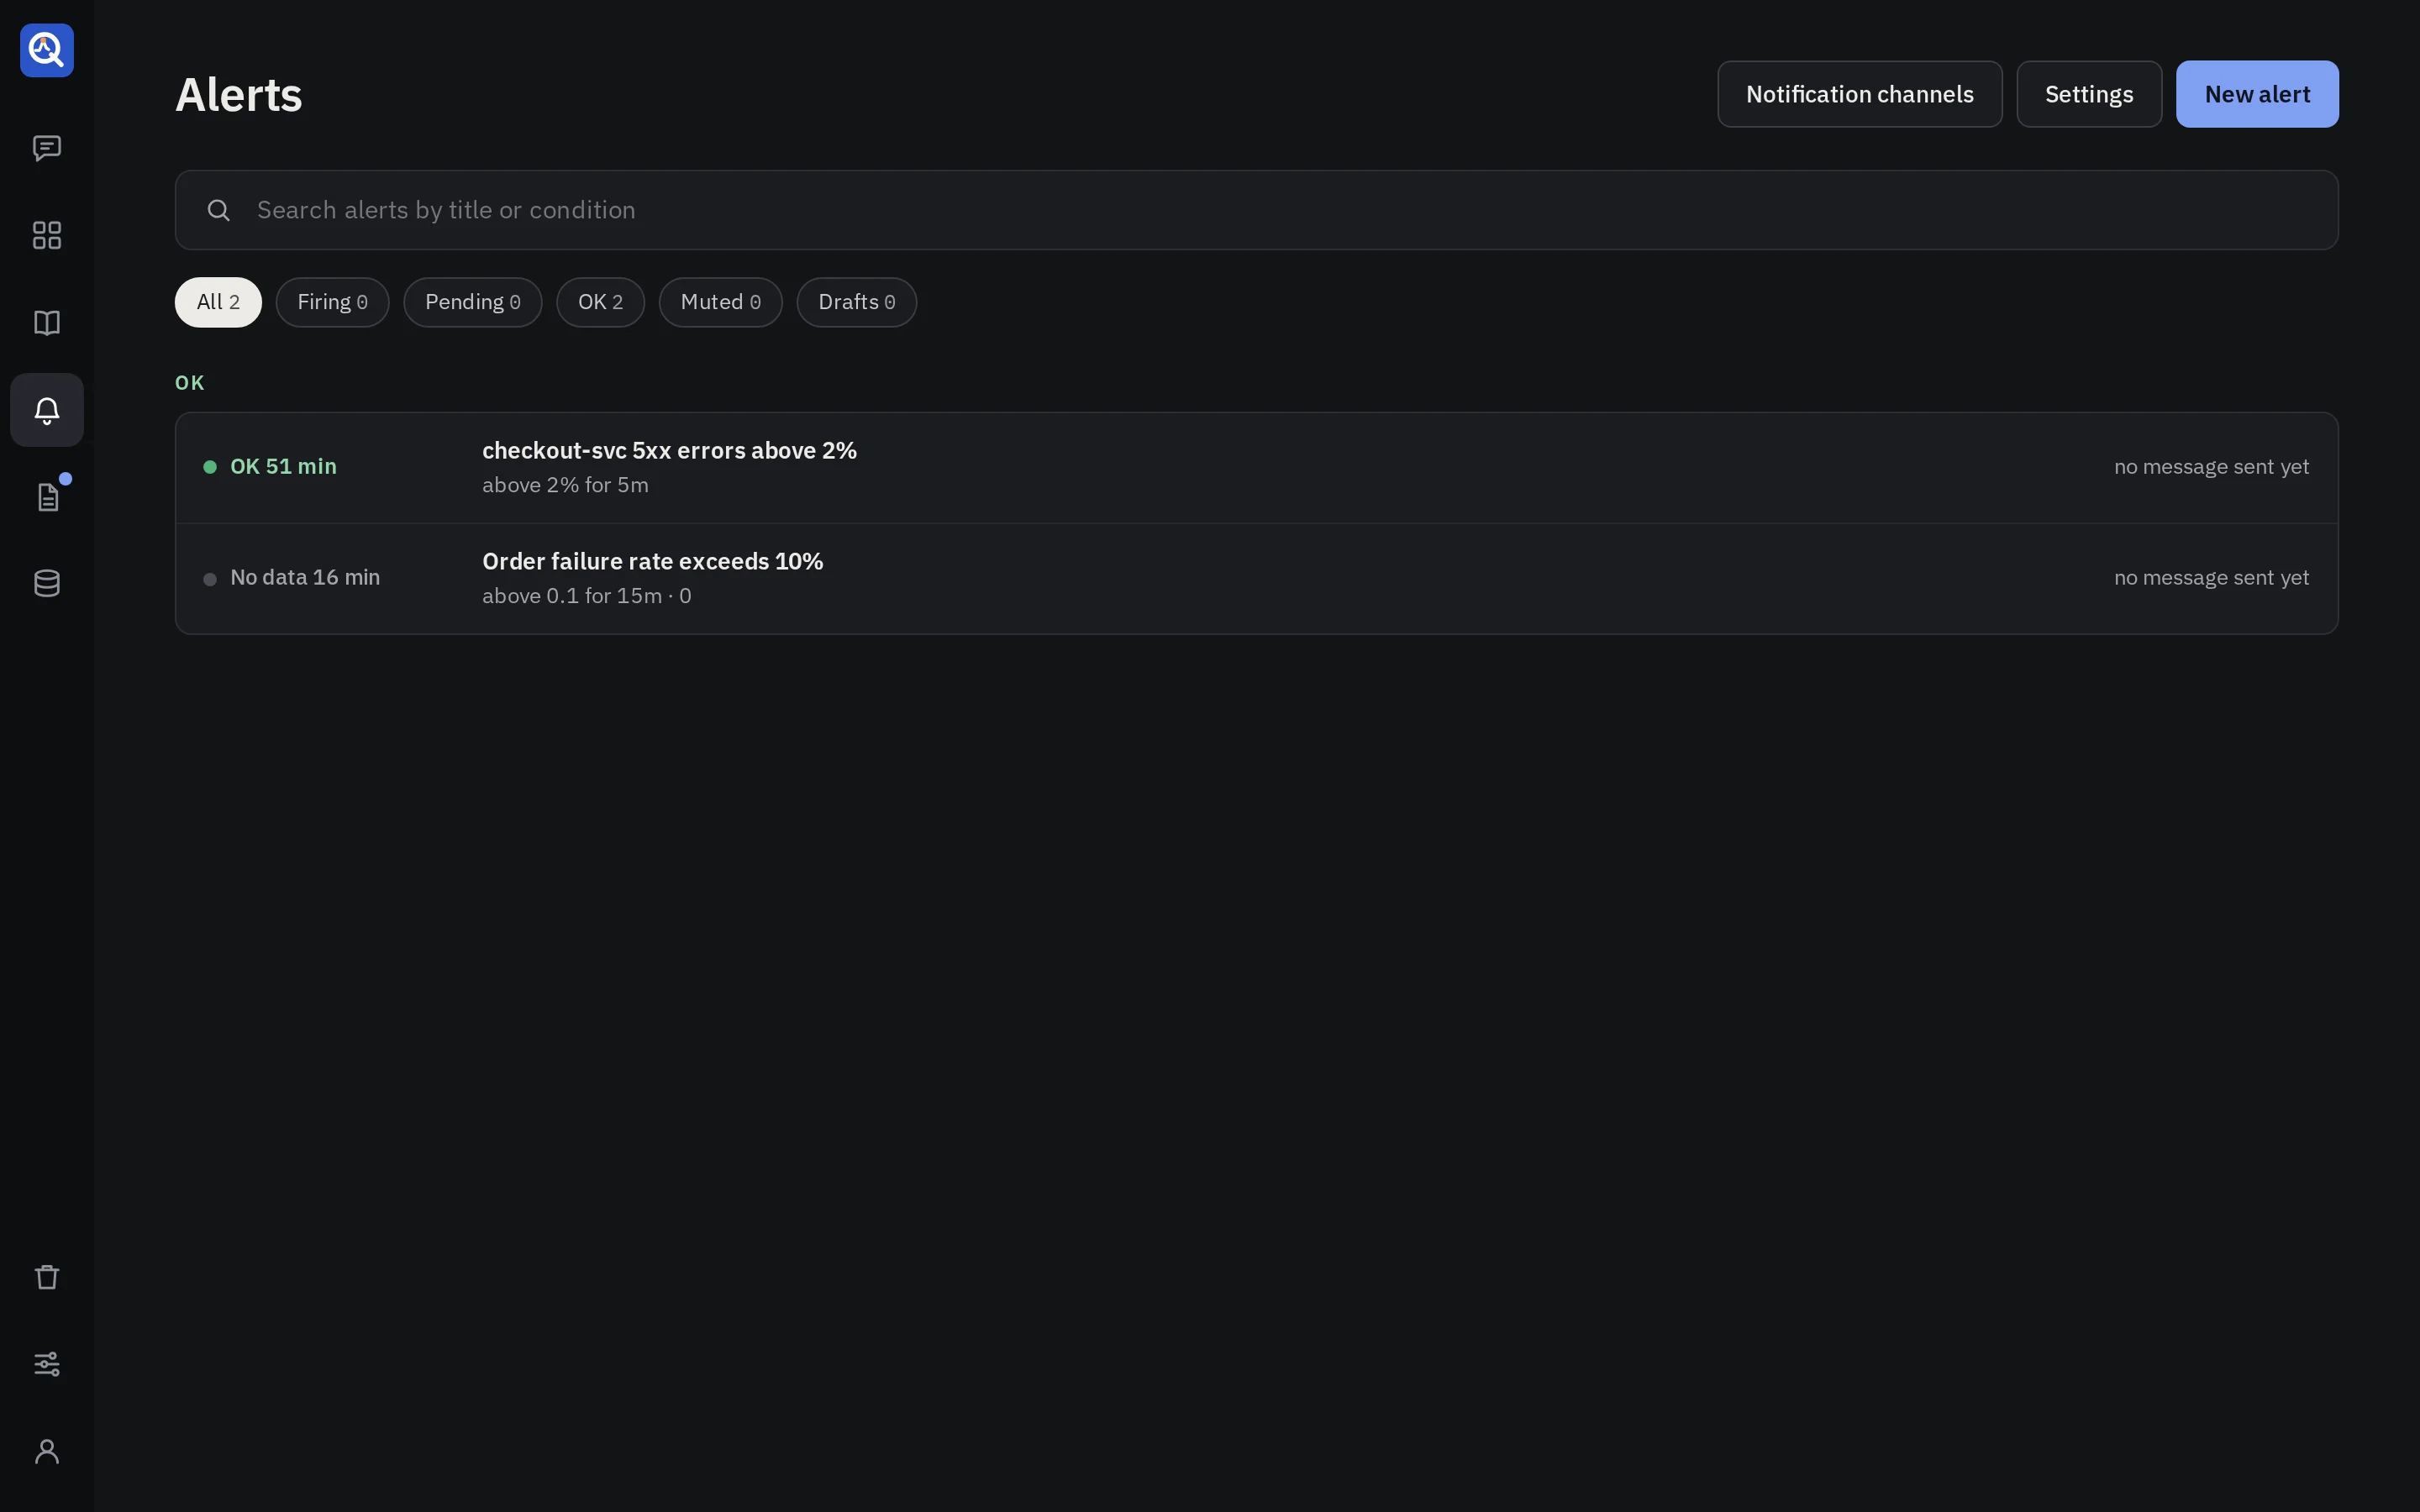
Alerts lists them by state: Firing, Pending and OK, then Drafts and Deactivated. Each row
shows its state and since when, the condition (above 2% for 5m), the worst series with its value,
and the latest message sent. Search and the state filter narrow it. The rail’s Alerts carries the
number of alerts firing.
An alert’s page
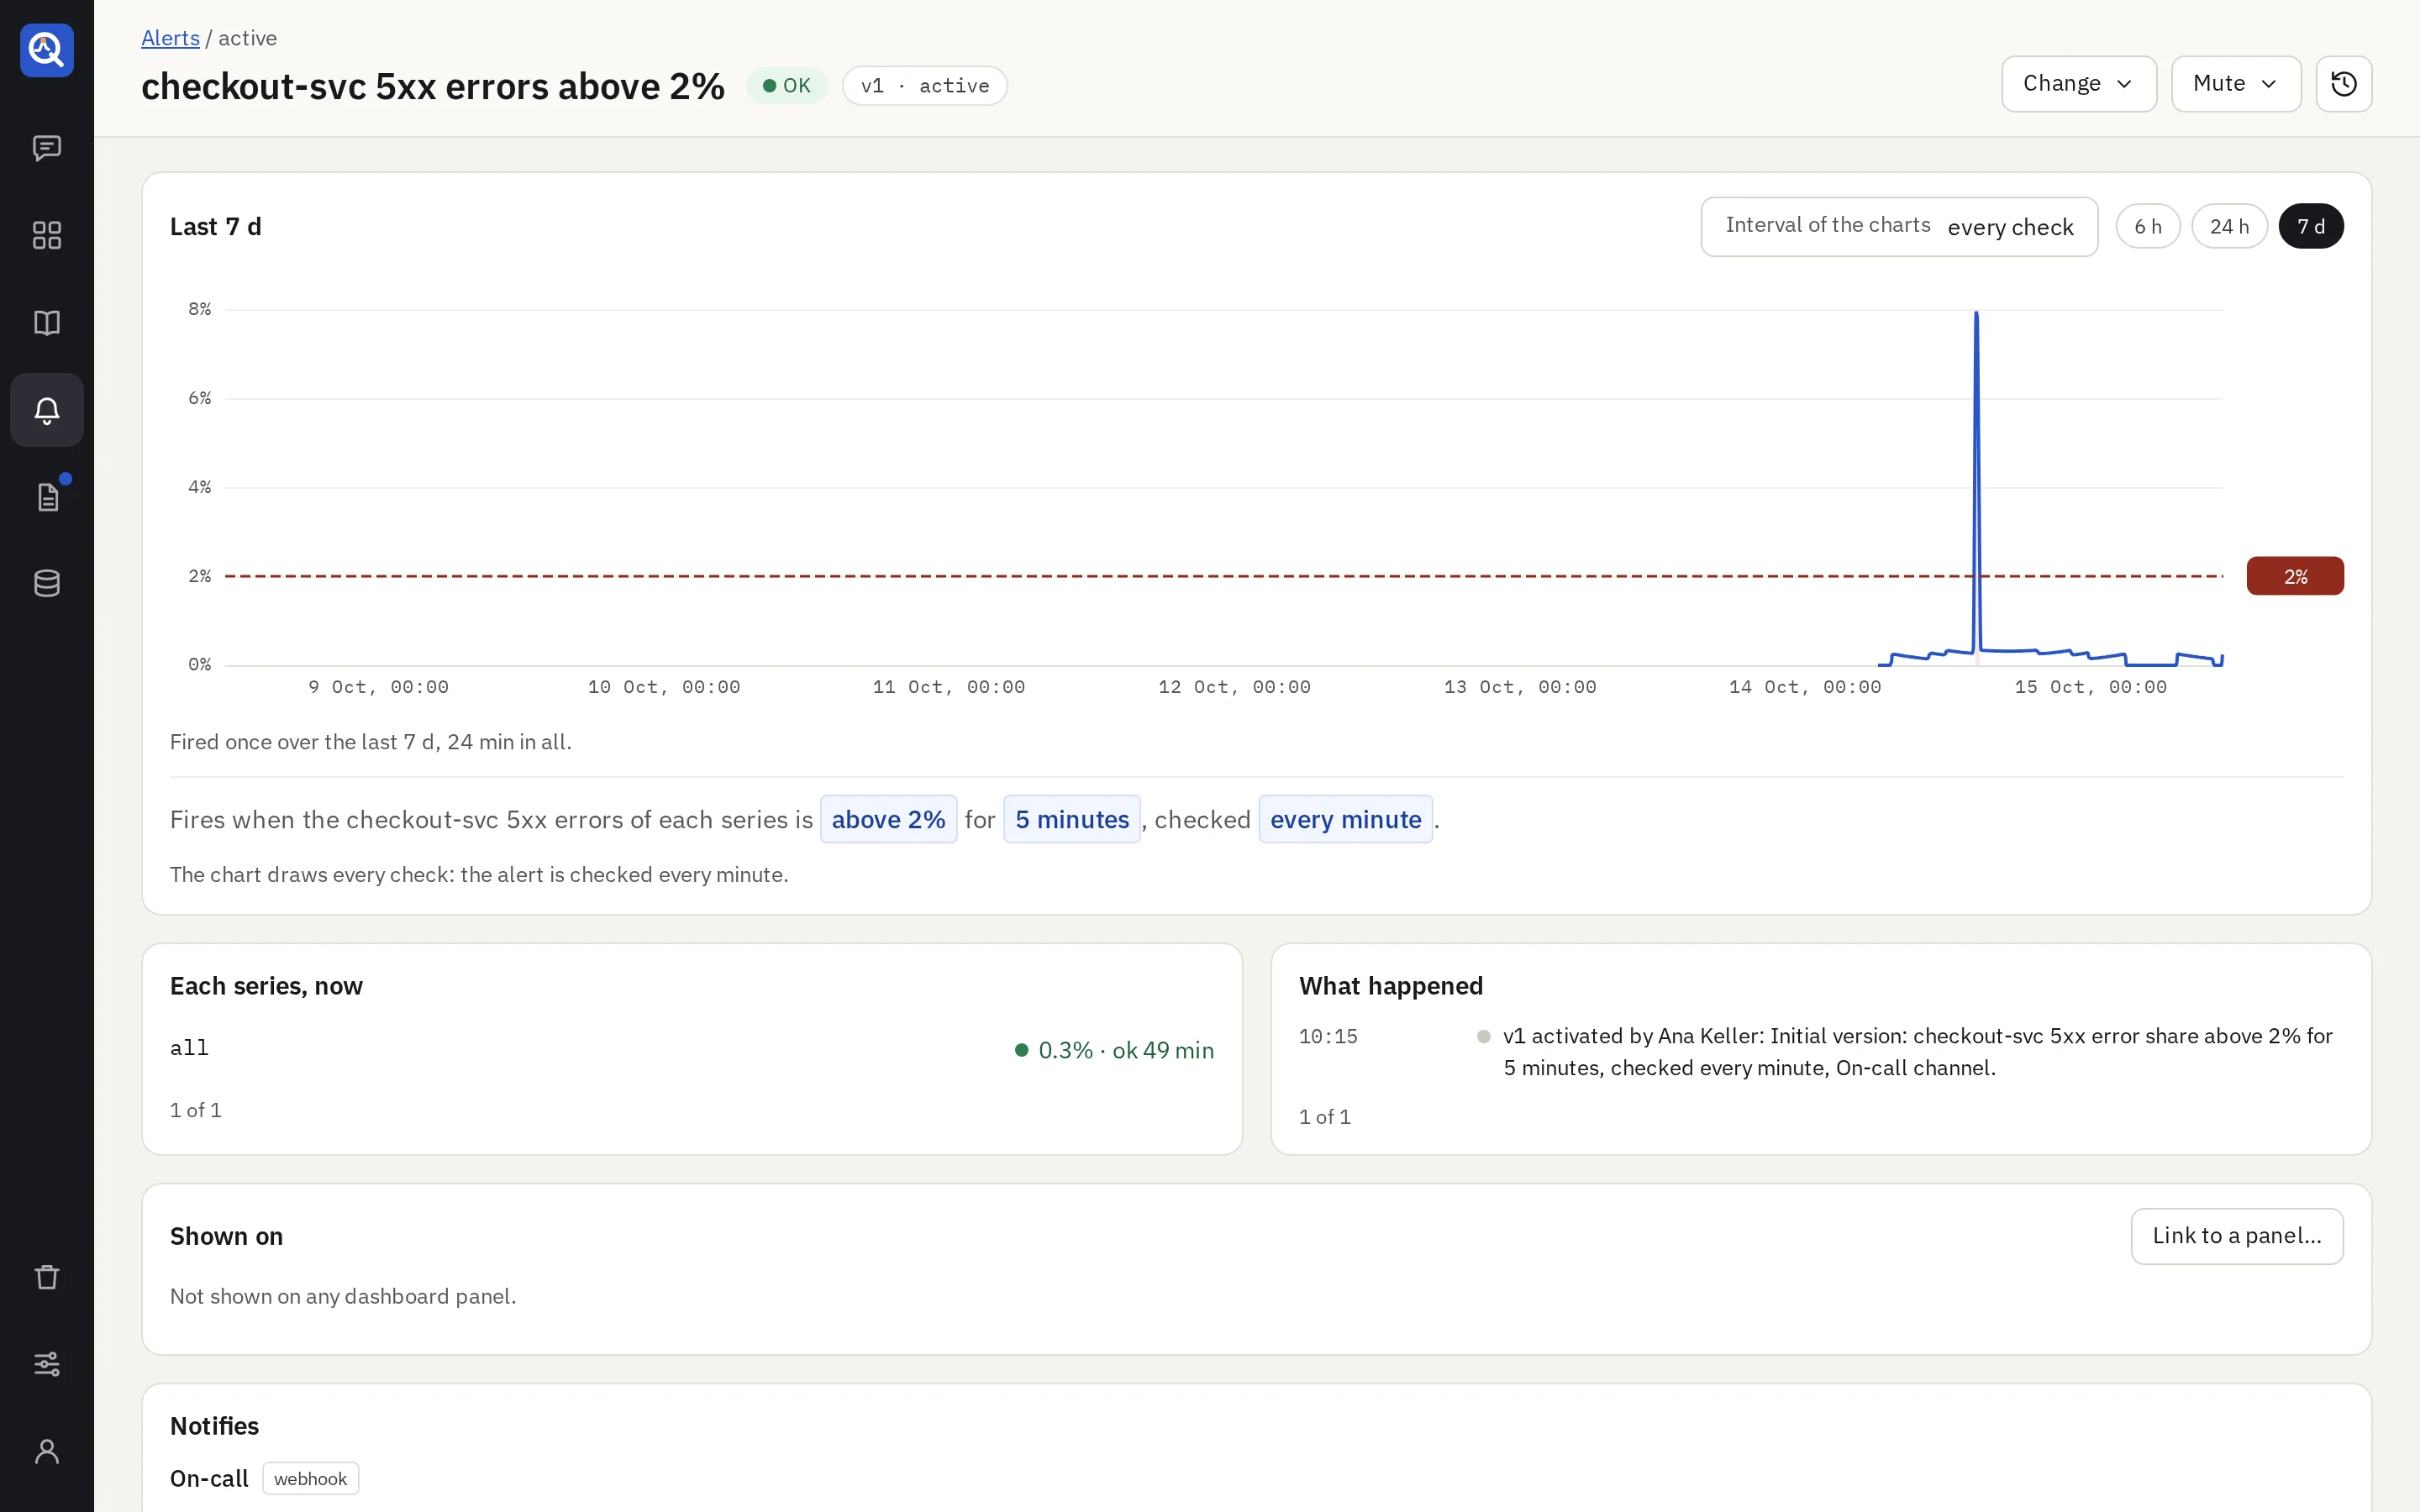
- The chart replays the shown version over 6 hours, 24 hours or 7 days, with the threshold and the firing periods. The $interval chip chooses how fine the line is drawn.
- Series gives each series’ state, value and since when, the worst first and ten at a time.
- What happened lists the changes of state, whether each notified or was held back by quiet hours, the times it could not be checked, and who activated, deactivated, muted or unmuted it. It shows the latest 10 entries and says how many there are in all. Older and Newer move through the rest, ten at a time.
- Notifies lists the channels, its quiet hours and the latest messages, with whether they got through, ten at a time as well. During quiet hours the header says Quiet hours until 07:00, and Notifies says when it may next notify.
- Shown on lists the dashboard panels it is linked to.
The interval of the chart
An alert has two rhythms, and they are not the same thing.
- How often it is checked is part of the alert: “checked every minute”. Each check runs the query, judges the condition and may notify.
- The interval of the chart is only how the line is drawn. The chart draws every check, so the line shows what the condition is judged on.
The $interval chip on the chart chooses a calmer line, on the alert’s page and in the draft
pane: every check, or one point per 5m, 10m, 30m, 1h, 6h or 1d, the mean of the
checks in it, as far as they suit the window and are wider than the time between checks.
- It changes the line and nothing else. The condition, how often the alert is checked, the window of each check and its state stay as they are. No query runs again.
- The shaded firing periods, the spikes too short to fire and the counts always come from the checks, whatever the interval.
- So under a chosen interval the alert can fire where the line stays under the threshold. A spike of two minutes weighs little in the mean of an hour. Choose every check again to see what each check saw.
- Dragging the threshold judges the checks again, not the drawn line.
The sentence under the chart says both: “The chart draws one point per 1h, the mean of the checks in it. The alert is still checked every minute: the firing periods come from those checks, not from the line.”
A query that counts by time has a third width, that of its buckets. The agent never writes it as a number: the alert takes it from the window of each check (a minute for a window up to 2 hours), and it is the same in a check and on the chart’s week. It is in the alert spec.
Tune a live alert
The owner of its thread and admins drag the threshold, or change the numbers of the condition, the wait or how often it is checked, right on the page. What the alert watches, and how far back a condition looks (the duration of a change, the period it compares with, the baseline of a band), change in its conversation. Nothing is saved yet: an amber bar says what the change would do (“Not saved: threshold 2% → 2.5%. Last 7 days: would have fired 1 time instead of 2. Right now: checkout-svc would stop firing.”). Discard drops it; Activate as v4 saves and activates it as a new version.
The header’s actions
- Mute (analysts and above): for 1 hour, 4 hours, until tomorrow 09:00, or until a time within 7 days. Editors may also mute until someone unmutes. A muted alert is still checked; it only stays quiet. A series still firing when the mute ends notifies then.
- Change (the owner of its thread and admins): Edit with the agent opens its thread; Deactivate stops checking it and resolves what was firing, so PagerDuty closes its incident; Activate starts it again.
- Versions: who saved each and when. The owner of its thread and admins activate another one.
Alerts on dashboards
An alert can be linked to the panels that show the same thing. A linked panel shows the alert’s state in its header, and its time chart draws the threshold and the firing periods. A toggle in the variables row hides them.
An alert on a ratio links by its first query. The panel shows its state and its firing periods, and no threshold line: the threshold is a number on the ratio, and the panel draws the first query’s values.
- The agent offers a link when an alert’s query matches a pinned panel’s. Only your Link makes it.
- On the alert’s page, Link to a panel… picks one by hand, and quanthea suggests the panels whose query matches, to Link or Dismiss.
Quiet hours
Quiet hours are the days and times an alert sends nothing: nights, weekends. The alert is still checked, and everything that happens to it stays in What happened.
- During quiet hours no message goes out: not a firing, not a repeat, not that the alert cannot be checked.
- When they end, each series still firing sends one message, and it says since when. An alert still unable to be checked says so then.
- What fired and resolved inside them sends nothing. It shows in the history, marked “held back by quiet hours”.
- What fired before them and resolved inside them says it resolved once they end, so a channel such as PagerDuty closes its incident.
- Deactivating an alert during quiet hours still resolves what was firing.
- The history has each change once, at the time it happened. A resolution, or an alert that can be checked again, during quiet hours is listed then, marked “held back by quiet hours”. The message that goes out once they end is not a new line there: it shows under the latest messages in Notifies. A repeat that was held back changes nothing, so it is not listed.
Quiet hours are windows on the clock of a named time zone: the days a window starts on, and the times it starts and ends. A window may cross midnight: Friday 22:00 to 07:00 ends on Saturday morning. The clock is the wall clock, so 22:00 stays 22:00 when daylight saving starts or ends. Messages go out at the first check after the window ends, so an alert checked every hour may catch up to an hour later.
Which quiet hours an alert keeps:
- Its own, when its version sets some (
quietHoursin the alert spec). They hold whatever its severity. Ask the agent in the alert’s thread: “not at night, not on weekends”, “quiet from 22:00 to 07:00, Zurich time”, “always notify” or “back to the default”. It offers them itself for an alert nobody needs waking for. - None, when its version says
none: it always notifies. - The default otherwise, which an admin sets in Settings or in the configuration file. Critical alerts ignore the default, so the ones that must wake someone do. An admin may spare other severities, or none.
A mute is separate: it silences one alert until a time, whatever the hour.
Settings
Admins open Settings on the Alerts page:
- The most alerts active per connector, 50 by default, so a source isn’t checked to death. An alert that compares with history runs two queries per check and counts twice.
- Notify when an alert cannot be checked or a report fails, on by default.
- Quiet hours by default, off by default. Turn it on and set the windows: the days each one starts on, and when it starts and ends. Add a window adds another, such as the whole weekend (Sat and Sun, 00:00 to 00:00). An end at or before the start is the next day. Then the time zone of the clock, and the severities that still notify at any hour. The dialog reads the windows back in a sentence before you save.
The same settings, and the default quiet hours, can come from the configuration file. The file then manages them, and saving the dialog is refused.
Messages go to the channels admins set up in Notifications. Without a channel, an alert still fires on its page; the agent says an admin can add one.