


Reports
A report runs a set of panels on a schedule, over a period, and sends the result: “every Monday at 8:00, last week’s sales, compared with the week before”. The agent writes it once in a conversation. Each run is computed by quanthea with no model, and frozen.
Editors write and activate reports. Every role reads them and their runs.
A report’s drafts belong to the thread that wrote it. Its owner and admins see every version, and activate, deactivate, run and test it. Other editors read it as every role does: once it is active, with the versions ever active and their runs.
Write one
Open Threads, pick A report, and say when it runs, what it covers and who hears:
Every Monday at 8:00, last week’s sales: revenue, orders, average basket and the 5 best-selling products, compared with the week before. Link the sales overview.
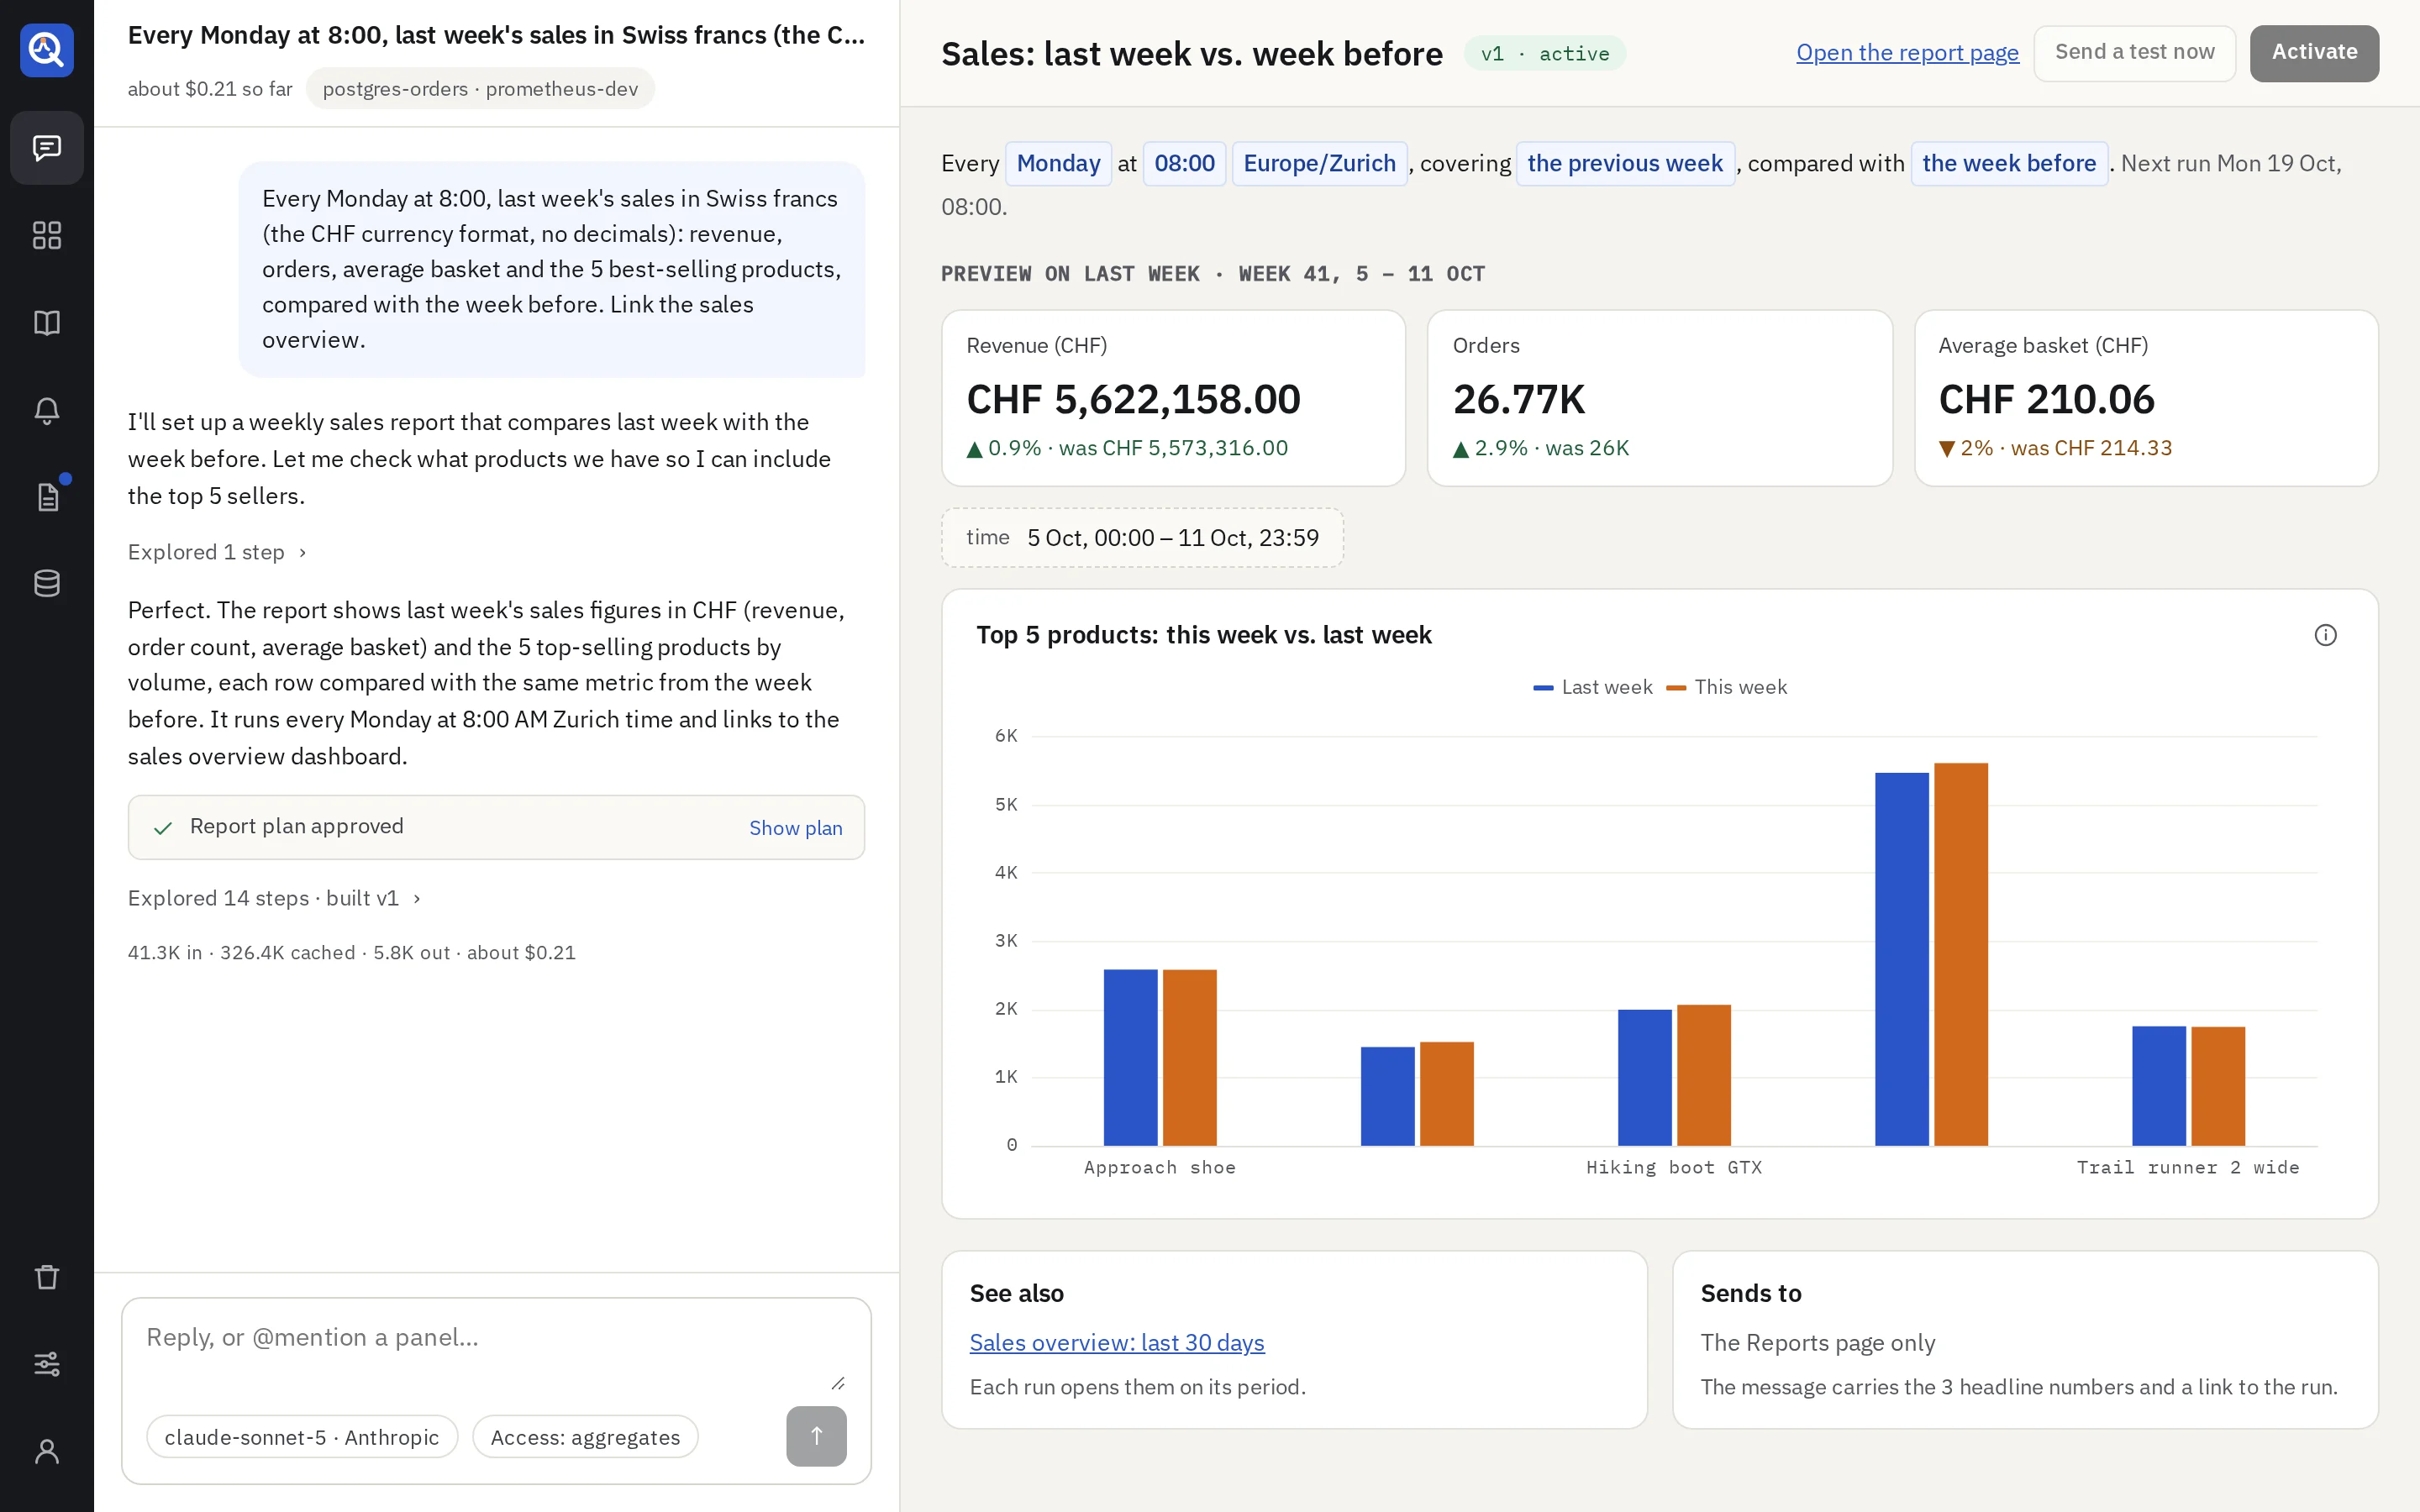
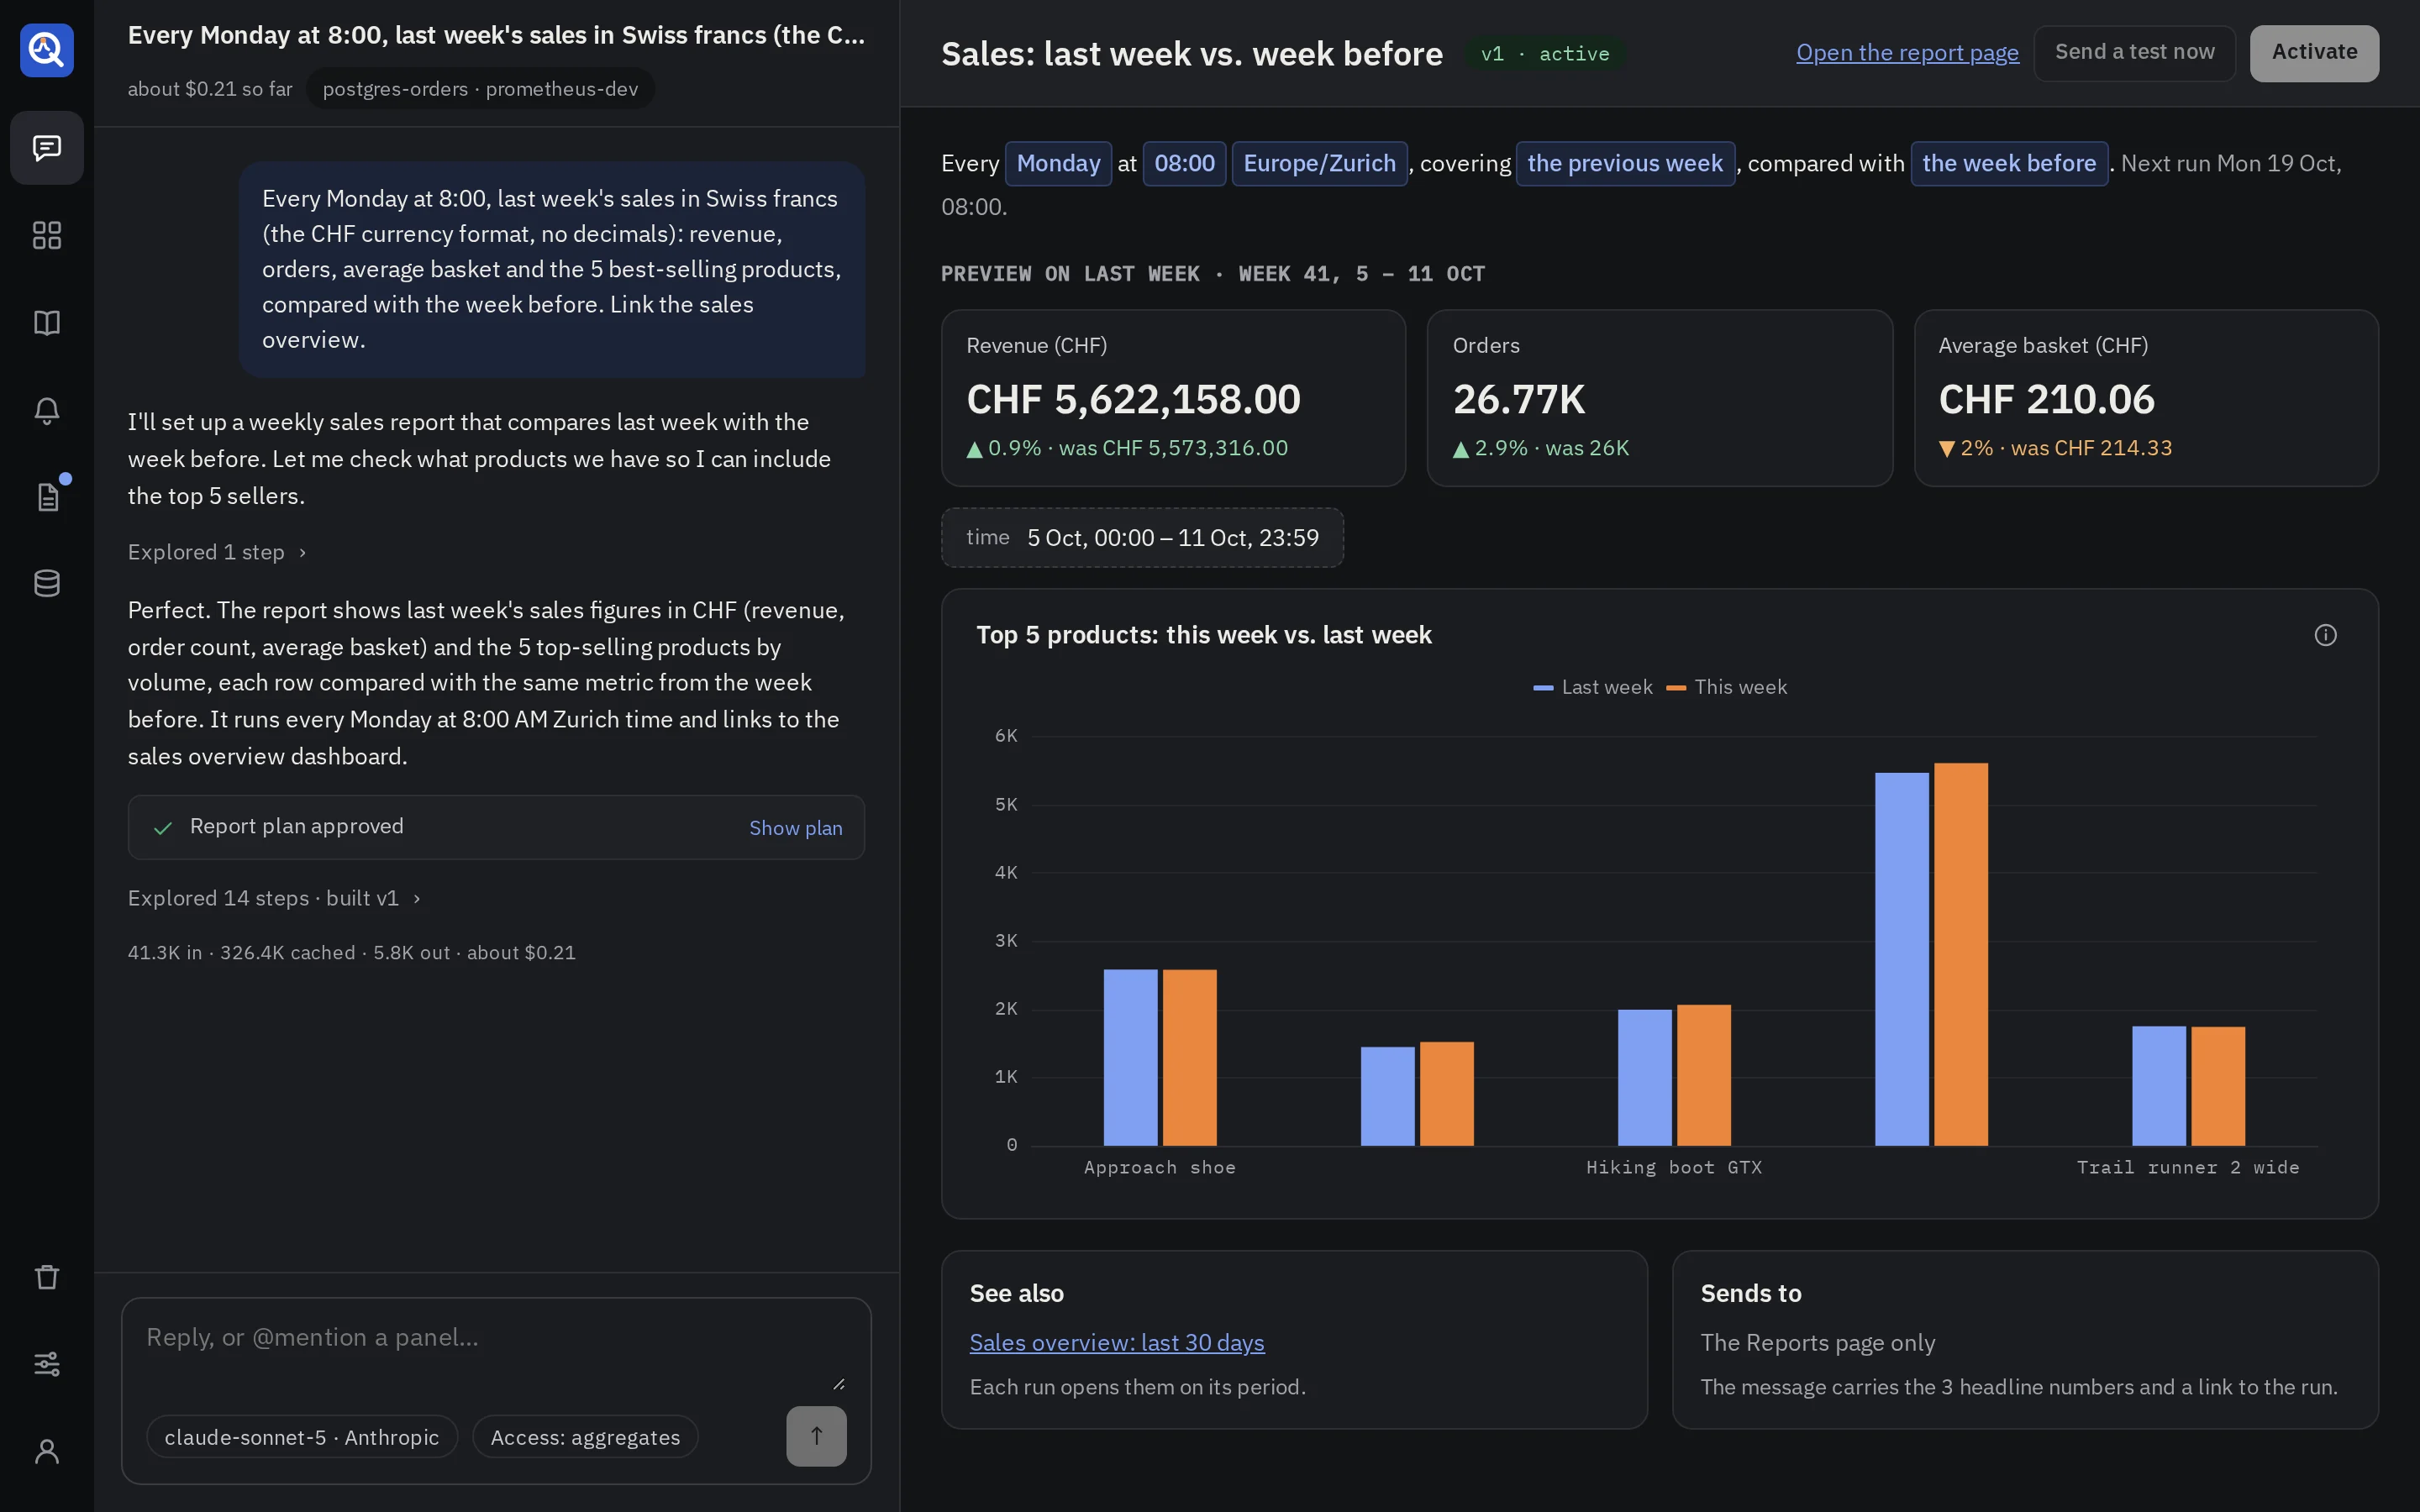
The agent proposes a plan: Runs, Covers, Compares, Shows, See also (pinned dashboards it links to) and Sends to (the channels). Approve it, and the report appears in the draft pane, run once over its latest period.
The draft
- The schedule as a sentence: “Every Monday at 08:00 Europe/Zurich, covering the previous week, compared with the week before. Next run Mon 13 Oct, 08:00.” Click any value to change it: the day, the time, the time zone, the period or the comparison.
- The preview runs the latest version over its latest period. The headline numbers come
first, each with its change and the value before (
▲ 6.2% · was CHF 173,560); the other panels follow, arranged as that version is once you saved a layout for it. - See also and Sends to list the linked dashboards and the channels.
- Send a test now sends the message to its channels, marked as a test.
- Activate schedules it. Activating runs its queries once, and refuses one that fails.
Schedules and periods
A report runs every day, every week on a weekday, or every month on a day, at a time on its time zone’s clock. Daylight saving moves the instant, never the local time. A monthly report on the 31st runs on the last day of shorter months.
| Period | Covers |
|---|---|
| The previous day | yesterday, midnight to midnight |
| The previous week | Monday to Sunday (ISO weeks) |
| The previous month | the calendar month |
| This week so far | from Monday’s midnight to the time it runs |
The comparison runs every panel over the period before as well, so each headline number shows its change.
The reports list
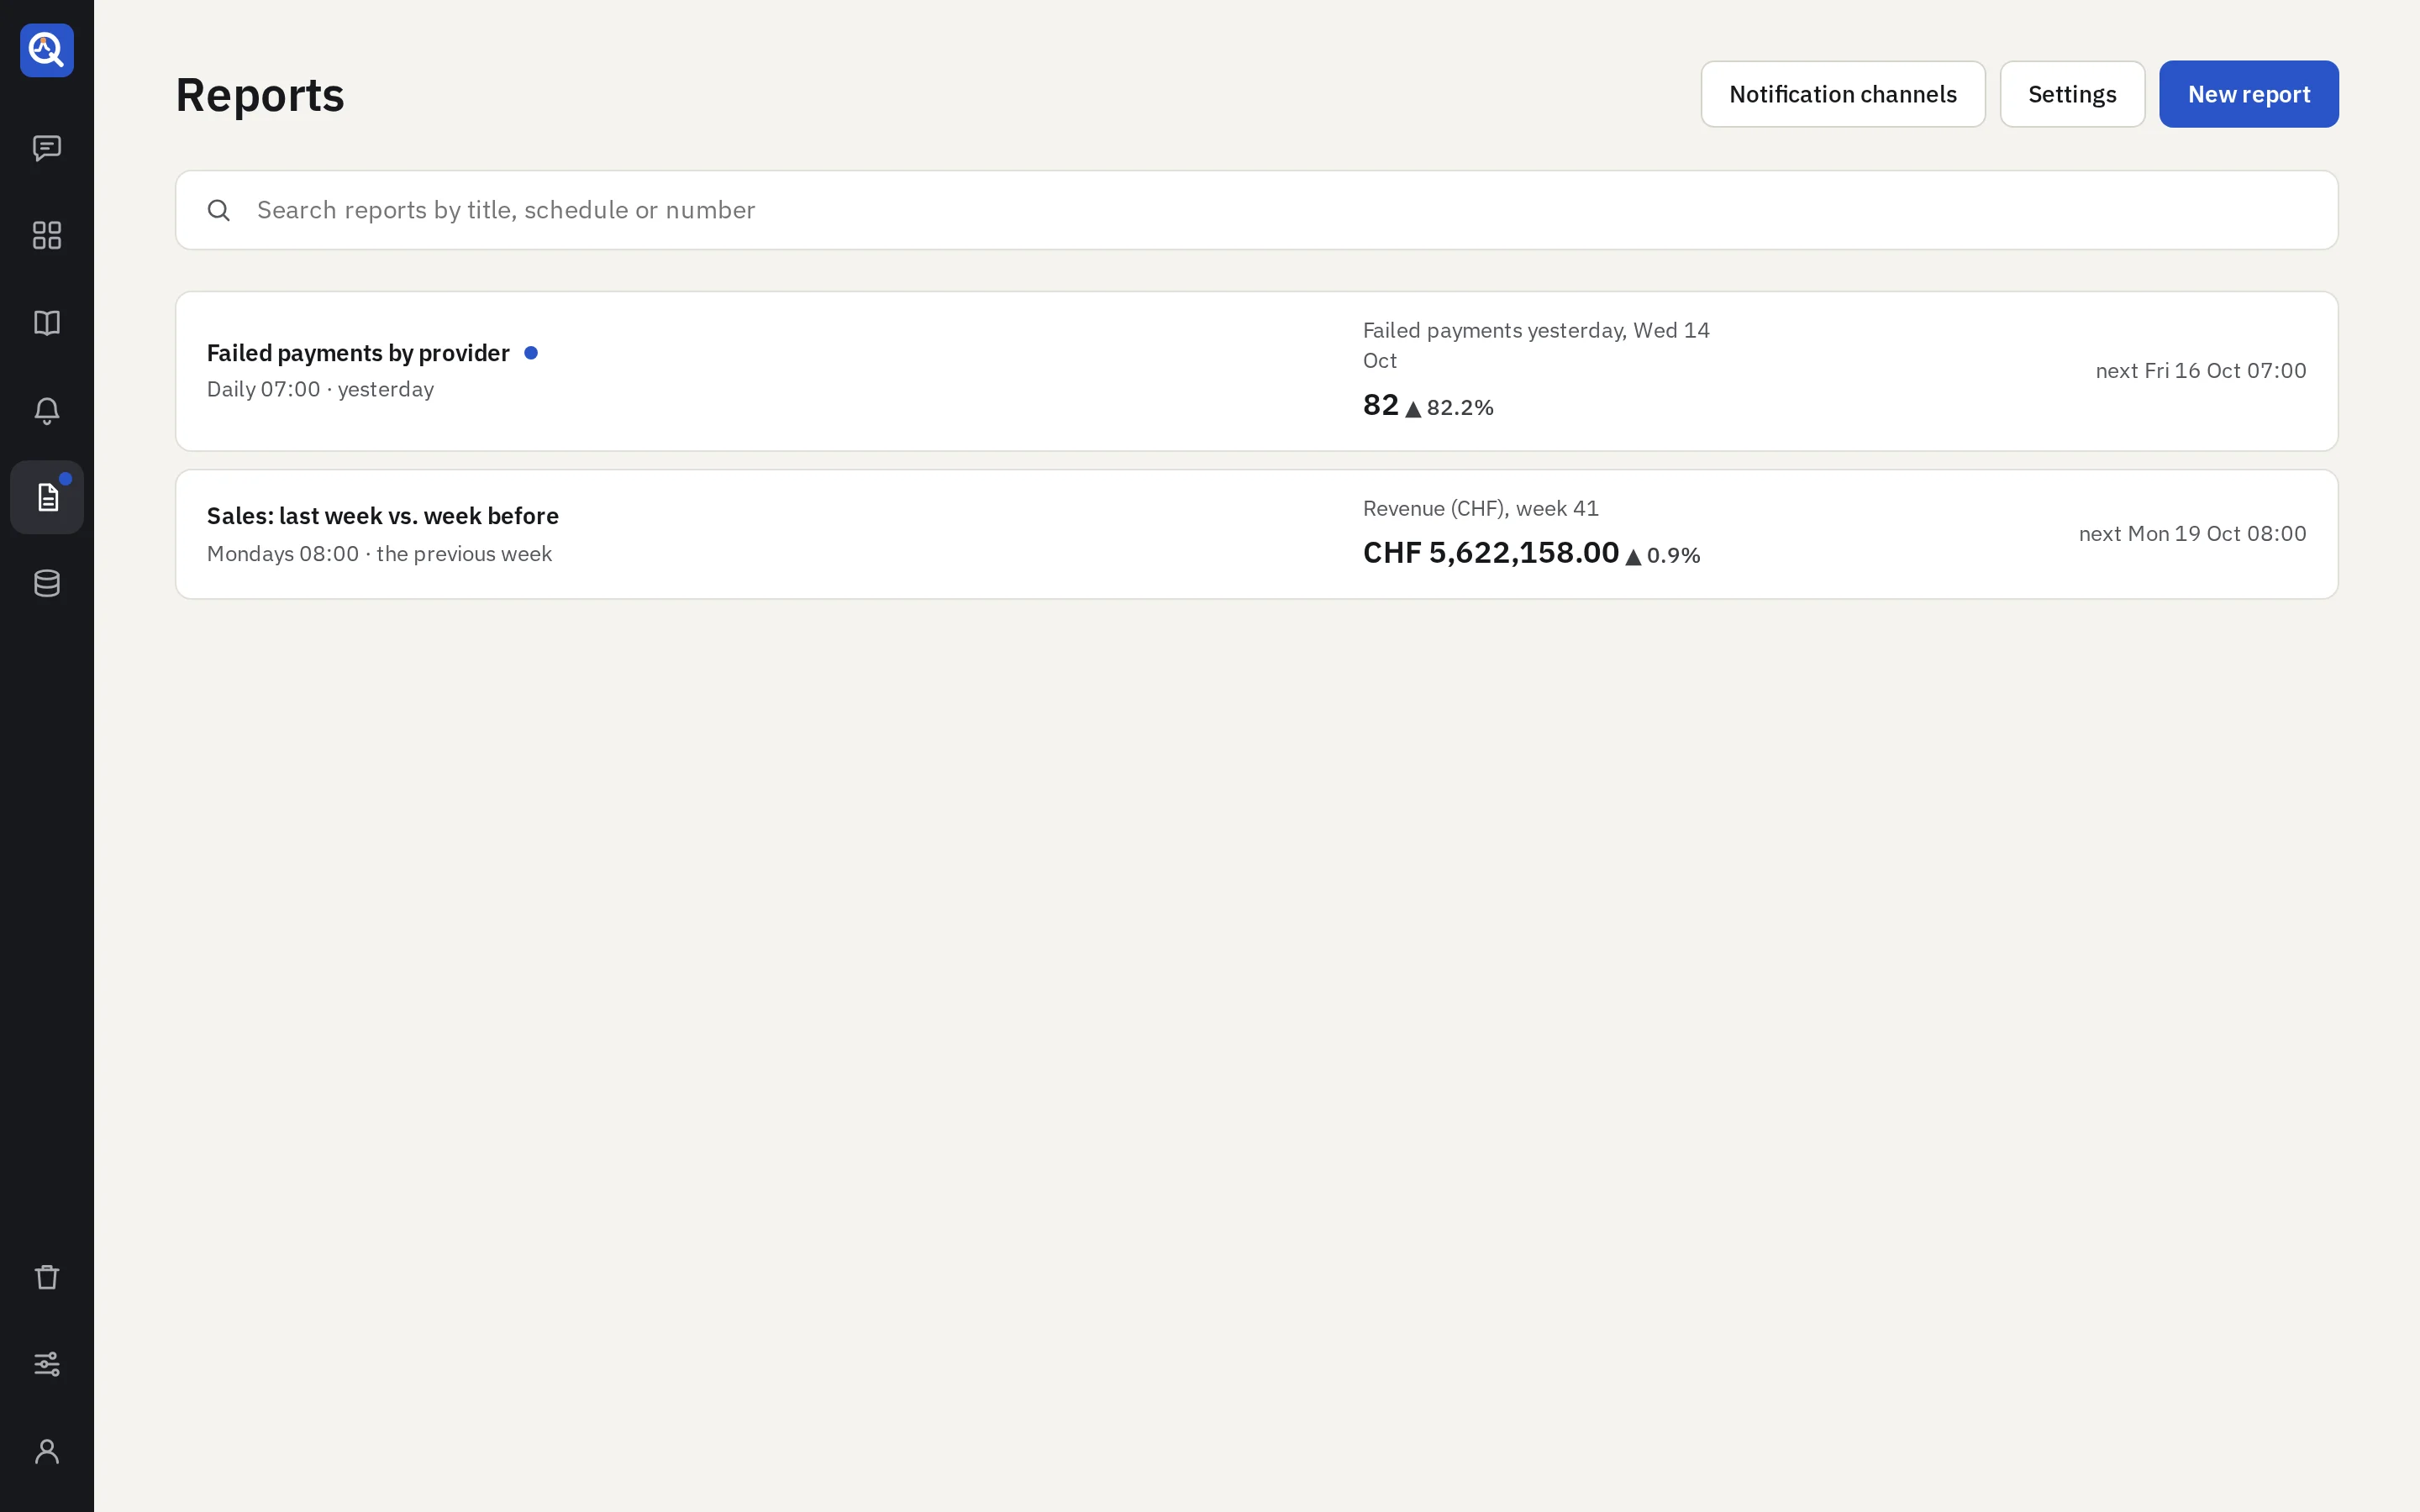
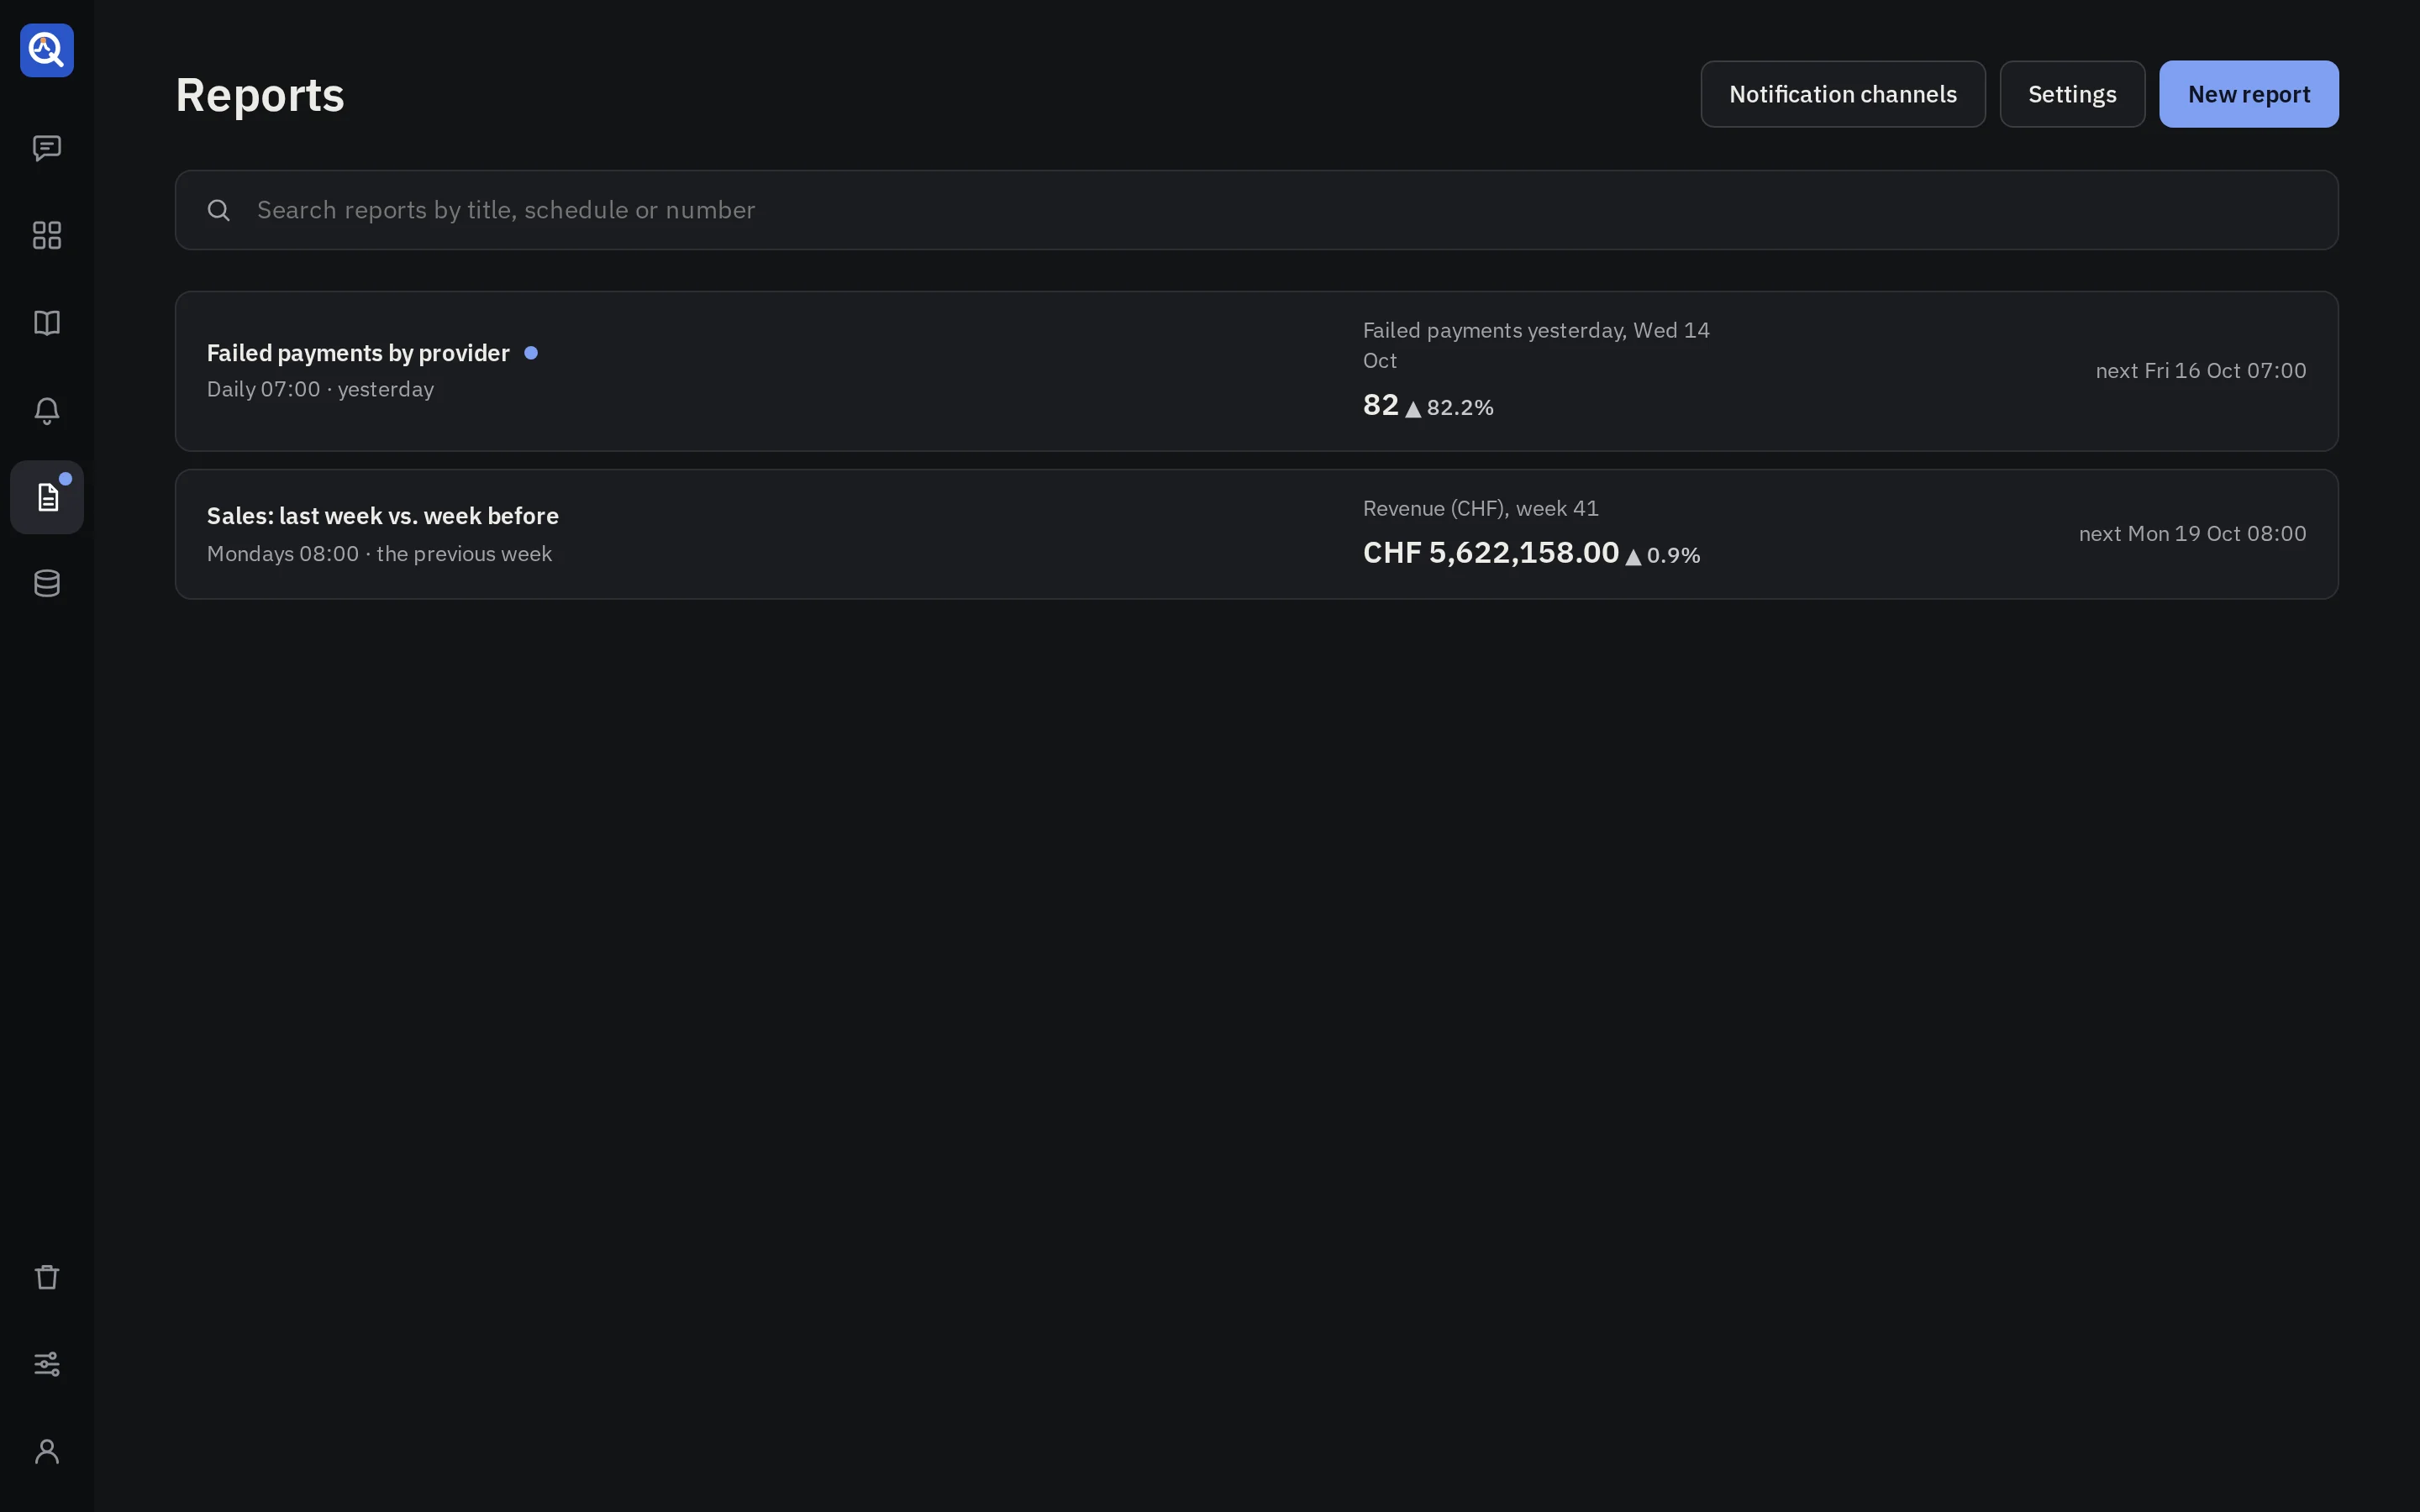
Reports lists each report with its schedule (Mondays 08:00 · the previous week), its latest
headline number with its change, a small history of that number over the last runs, and the next
run. A dot marks a report with a run you have not opened, and the rail’s Reports carries one too.
A run
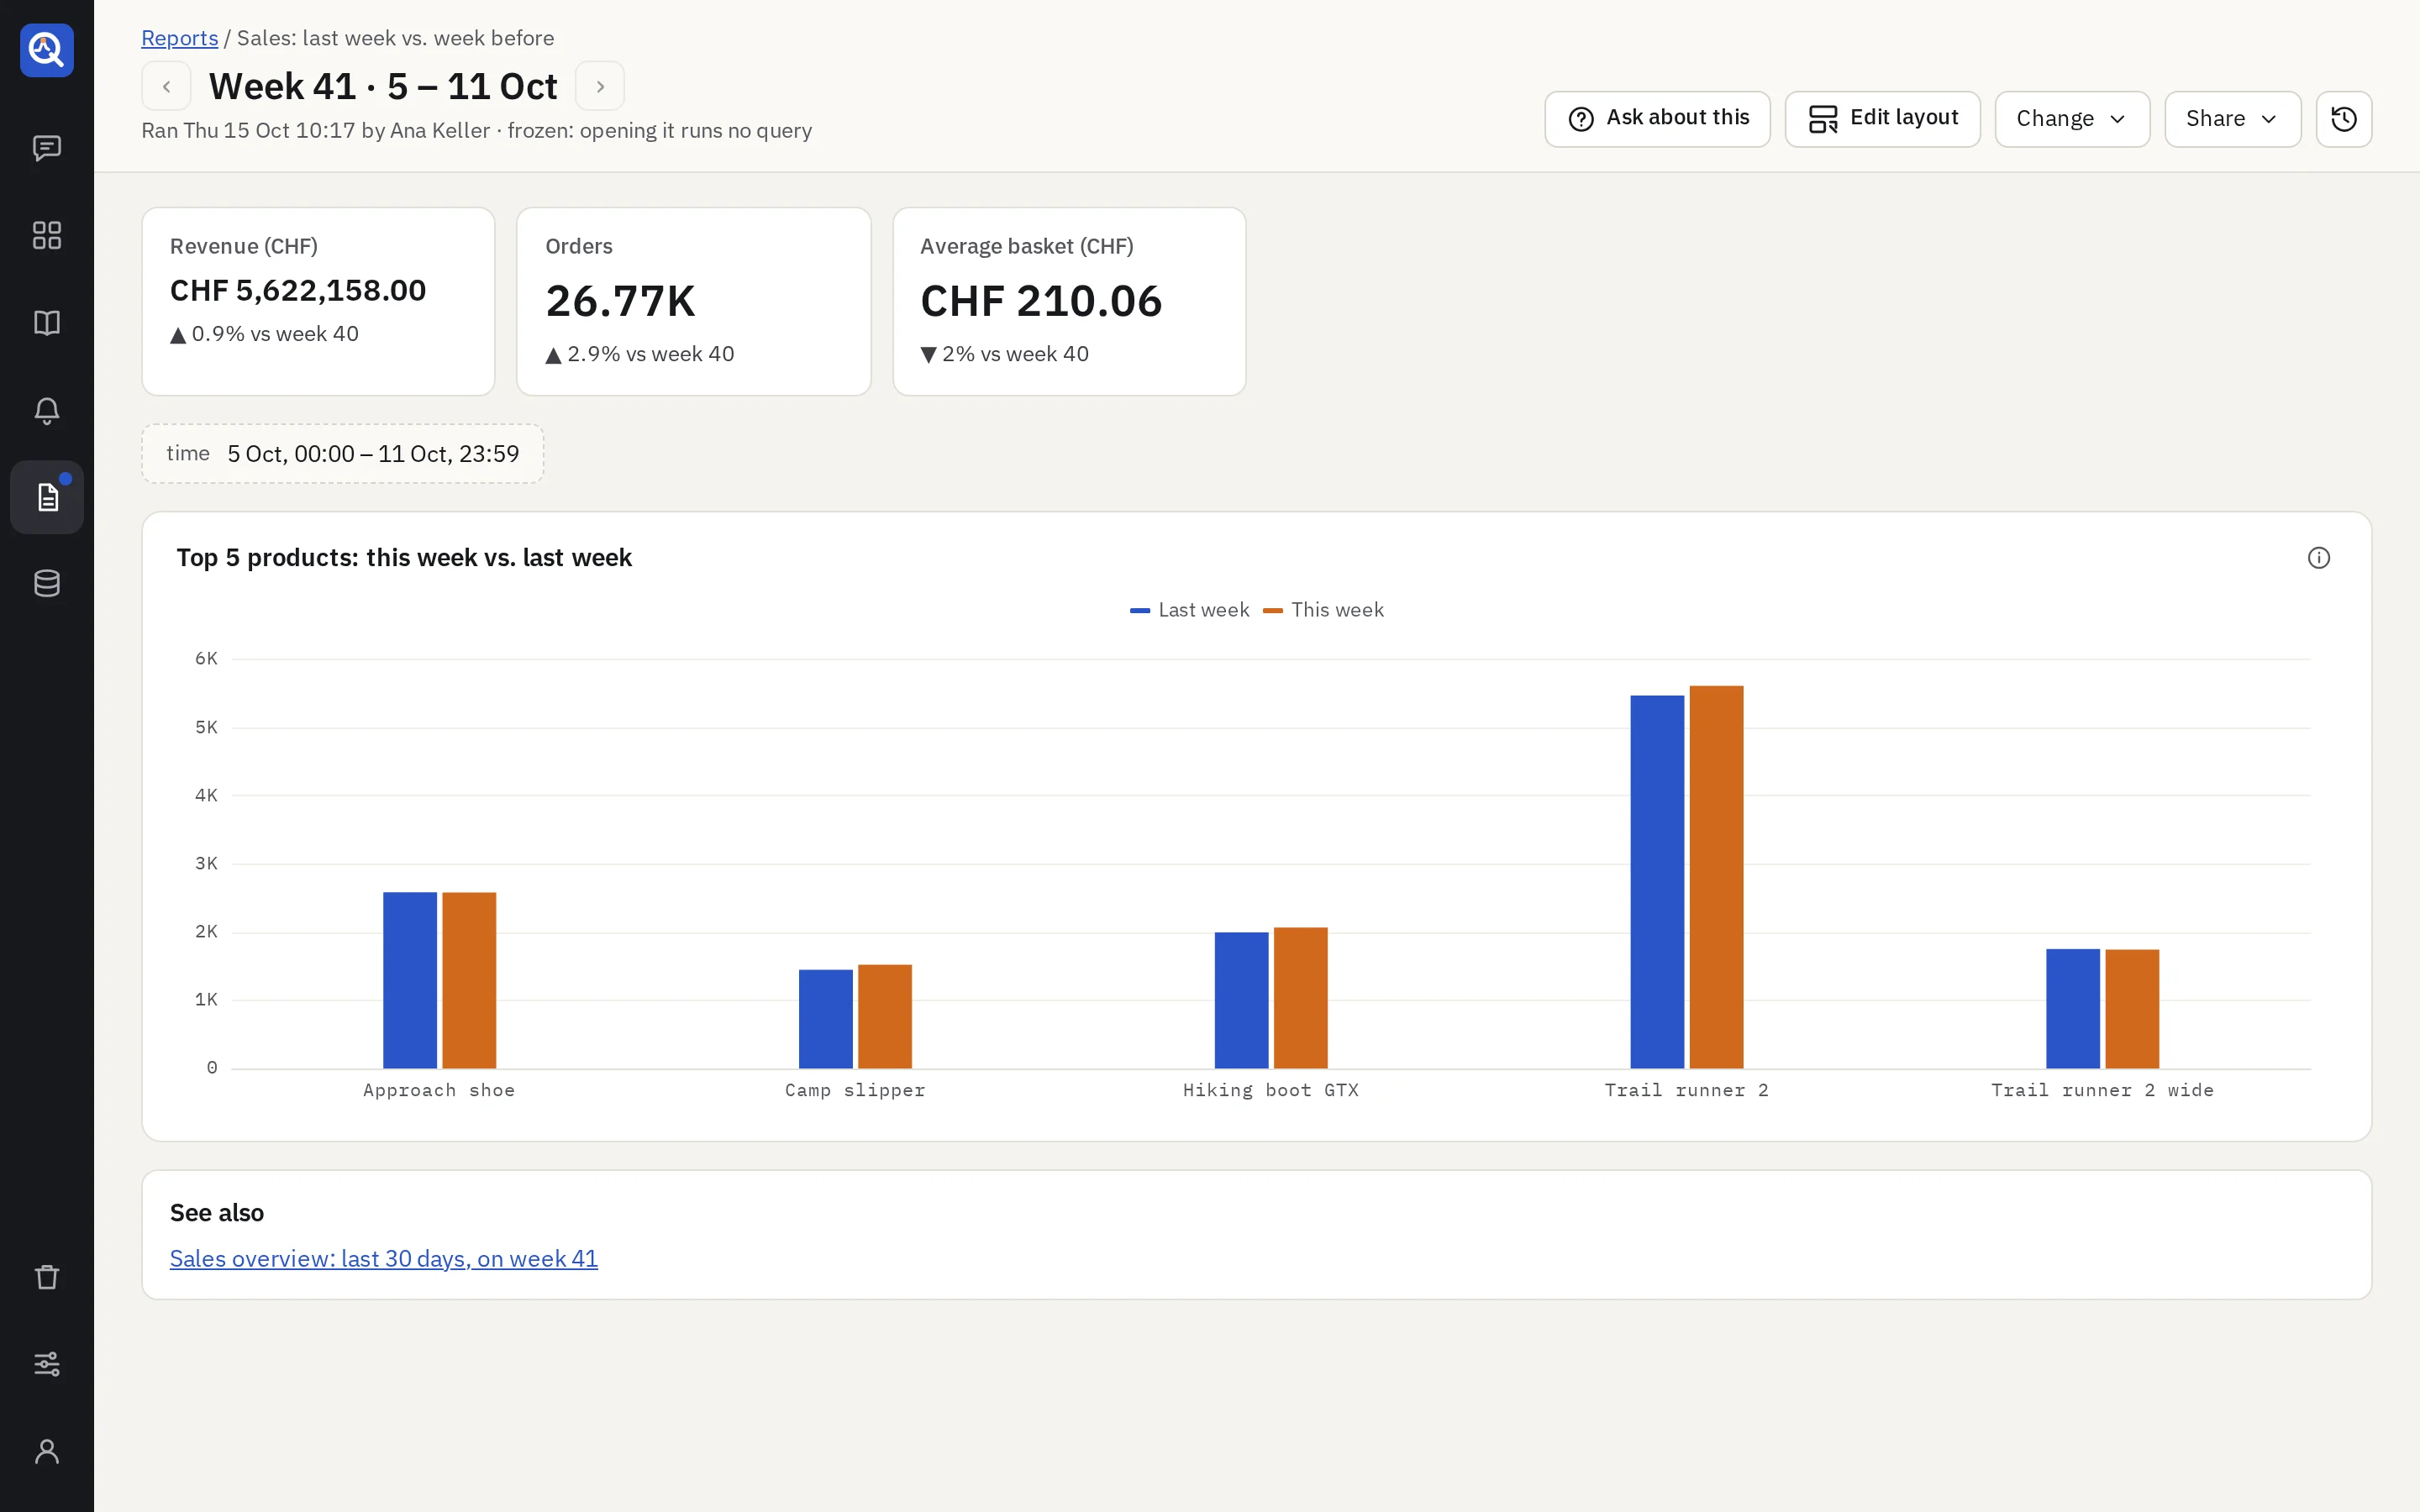
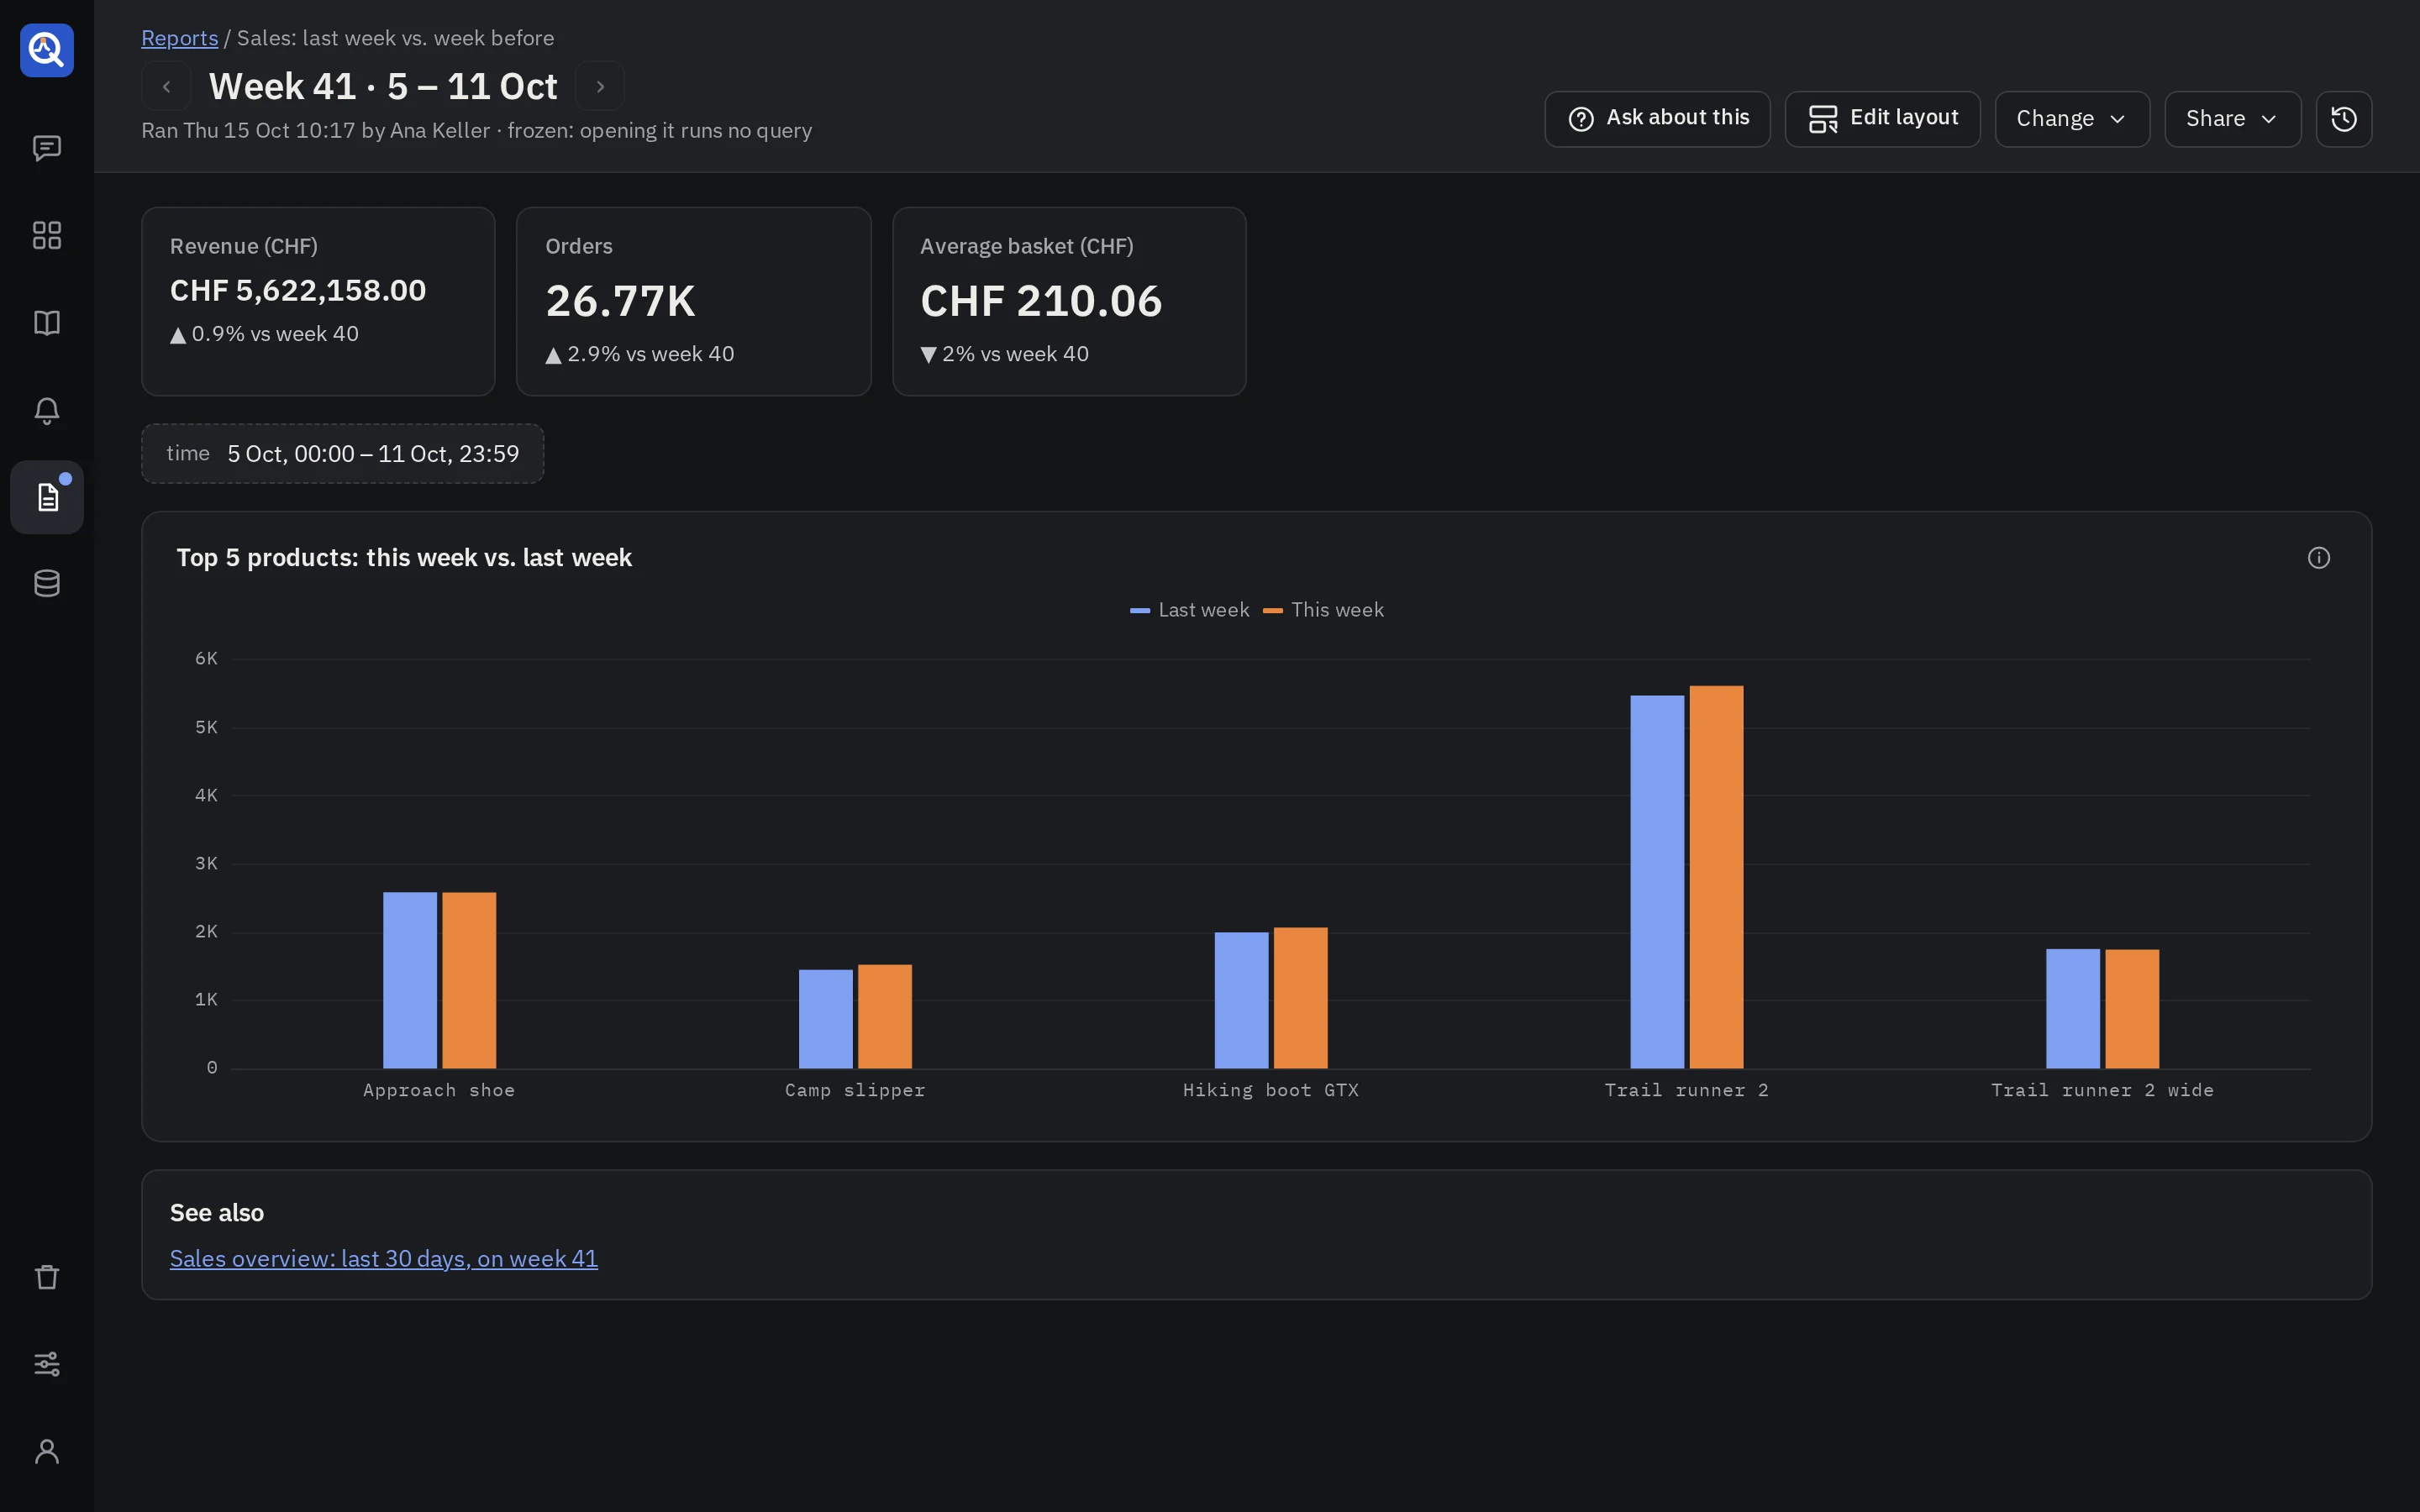
A run’s page shows the period as its title (Week 39 · 21 – 27 Sep), when it ran and where it
was sent, then the headline numbers and the panels. Opening it runs no query: the results were
frozen when it ran.
- ‹ and › step to the runs before and after.
- See also opens each linked dashboard on the run’s period.
- Ask about this asks questions about the run; see Ask about a report’s run.
- Change (the owner of its thread and admins): Edit with the agent, Run now (runs it over its latest period, and sends it only when you ask), Deactivate or Activate.
- Share → Copy link, and Versions for the owner of its thread and admins.
The interval of the charts
A time chart of a run shows the whole period of the run, from its start to its end, with a stretch that has no data left empty.
A run cuts its time charts into even intervals, taken from its period: a day by 10 minutes, a week by the hour, a month by the day. Ask the agent for another width, such as “last week’s sales per day”, and the report keeps it: every run then cuts its charts by the day.
The $interval chip above the panels draws them at another one: 1m, 5m, 10m, 30m, 1h,
6h or 1d, as far as they suit the period.
- The run kept its results as they ran, so another interval runs the charts’ queries again, over the run’s own period. The charts then show the data as it is now, and the page says so.
- Nothing is stored. The headline numbers, the tables and the message that was sent stay as the run kept them, and as stored brings the stored charts back.
- A chart whose query names its own step, such as one grouped by the minute, keeps what the run stored. A run without a chart that follows the interval shows no chip. The agent writes every chart over time by the interval, so this is a chart of a report written before it did.
- Reload the page, or open the run again, and it shows the run as stored.
Arrange the panels
The owner of its thread and admins arrange the panels under the headline numbers, as on a pinned dashboard. Edit layout shows on a run of the active version that succeeded, on a screen wide enough for the grid’s twelve columns.
- Move a panel by dragging its frame, and resize it by dragging the frame’s corner. Full width, Half width and Hide sit at the foot of each frame.
- A hidden panel stays in the report and is still computed by every run. It is not shown and is left out of questions about a run. Hidden in the bar lists them, and Show puts one back.
- Save layout shows the arrangement to everyone, on every run of that version, the earlier ones too. Cancel drops it. History lists the saved arrangements, and Restore brings one back.
- The headline numbers keep their row at the top, in the order the report gives them.
In the report’s thread, the agent arranges the panels of a draft when you ask in words, such as “the chart beside the table” or “both charts full width”. That writes a new draft version.
Arranging by hand makes no new version. Each version keeps its own arrangement: a version activated later starts from the grid the agent wrote. The message a report sends holds the headline numbers and the links, so it stays the same.
When a run fails
A run that fails tries again, 2 times by default, 15 minutes apart. Past that it is marked failed with its reason, and its channels hear so, when the alert setting Notify when an alert cannot be checked or a report fails is on. After downtime, a report runs once for the latest missed period, never a backlog.
Settings
Admins open Settings on the Reports page:
- Retries and the delay between them, from a minute to a day.
- How long runs are kept: for good (the default) or a number of days. Reports and their versions always stay.
Messages go to the channels admins set up in Notifications. Each message carries the period, the headline numbers with their change, a link to the run and links to the dashboards.